







Organizing Magic Fire powder purchasing and margin data sounds tedious until a buyer's diligence team starts asking questions our factory has heard clients struggle with for years Hojas de datos de seguridad de materiales 1. Messy invoices kill deals. Clean data closes them.
Organize Magic Fire powder purchasing and margin data for due diligence by building one SKU-level workbook covering landed cost, Cost of Goods Sold, selling price, units sold, and gross margin per period, backed by reconciled supplier invoices, compliance certificates, and documented lead-time records.
That is the short answer. Now let me walk you through each piece, step by step, based on what we see buyers actually request when our brand clients prepare for a sale.
What certifications and compliance documents should I include to satisfy due diligence buyers?
A few years back, one of our European distributor clients nearly lost a brand sale because a single SGS test report had expired mid-negotiation. We re-issued it within weeks, but the lesson stuck with me.
Include ISO 9001 and BSCI factory certifications, CE markings, SGS or Intertek test reports, Material Safety Data Sheets for the flame-coloring powder, regional environmental compliance records, warning-label approvals, and import documentation—all current, organized by SKU, and matched to specific production batches.

Compliance paperwork is the first thing a serious buyer opens. Why? Because a novelty flame-coloring product sits in a regulated category. If the documents are missing or stale, the buyer assumes hidden liability. That fear alone can cut your valuation before anyone even looks at your Gross Profit Margin 2.
Build a compliance index, not a folder dump
Do not just drop PDFs into a shared drive. Create an index sheet. Each row lists the document, the issuing body, the issue date, the expiry date, and the SKUs it covers. Buyers love this because they can verify coverage in minutes.
Here is the structure we recommend to our private-label clients:
| Tipo de documento | Issuing Body | Lo Que Demuestra | Renewal Cycle |
|---|---|---|---|
| ISO 9001 3 certificado | Registrador acreditado | Quality management system at the factory | Every 3 years, annual audits |
| Auditoría BSCI 4 informe | Amfori auditor | Cumplimiento social y ético | Annual |
| Conformidad CE 5 archivo | Notified body / self-declaration | Acceso al mercado de la UE | Per product change |
| Informe de prueba SGS / Intertek | Laboratorio de terceros | Chemical safety, no harmful substances | Per batch or formulation change |
| FDS / SDS | Fabricante | Datos de manipulación, almacenamiento y peligros | On formulation change |
| Warning label approval | Legal / regulatory review | Consumer safety labeling | Per market |
Map your regulatory moat
Compliance is not just defense. It is an asset. In our seventeen-plus years supplying color-flame products to the US, Germany, the UK, and beyond, we have seen buyers pay more for brands whose supply chain documentation proves a compliance barrier that competitors cannot copy overnight. Document any exclusive formulations, private-label agreements, or market-specific approvals. That paperwork is part of your moat, and it belongs in the data room front and center.
Also link each certificate to the batches it covers. A buyer testing earnings quality will spot-check whether the units you sold were actually covered by valid reports at the time of sale.
How do I calculate and present accurate margin data across different MOQ tiers?
There is a trade-off we discuss with almost every new buyer: lower MOQs mean flexibility for trial orders, but the per-unit cost shifts, and that shift must show up honestly in the margin model.
Calculate margin per MOQ tier by computing full landed cost per unit at each order quantity—factory price plus freight, duties, and inbound handling—then present gross profit per unit and Gross Profit Margin percentage side by side, so buyers see how unit economics change with volume.
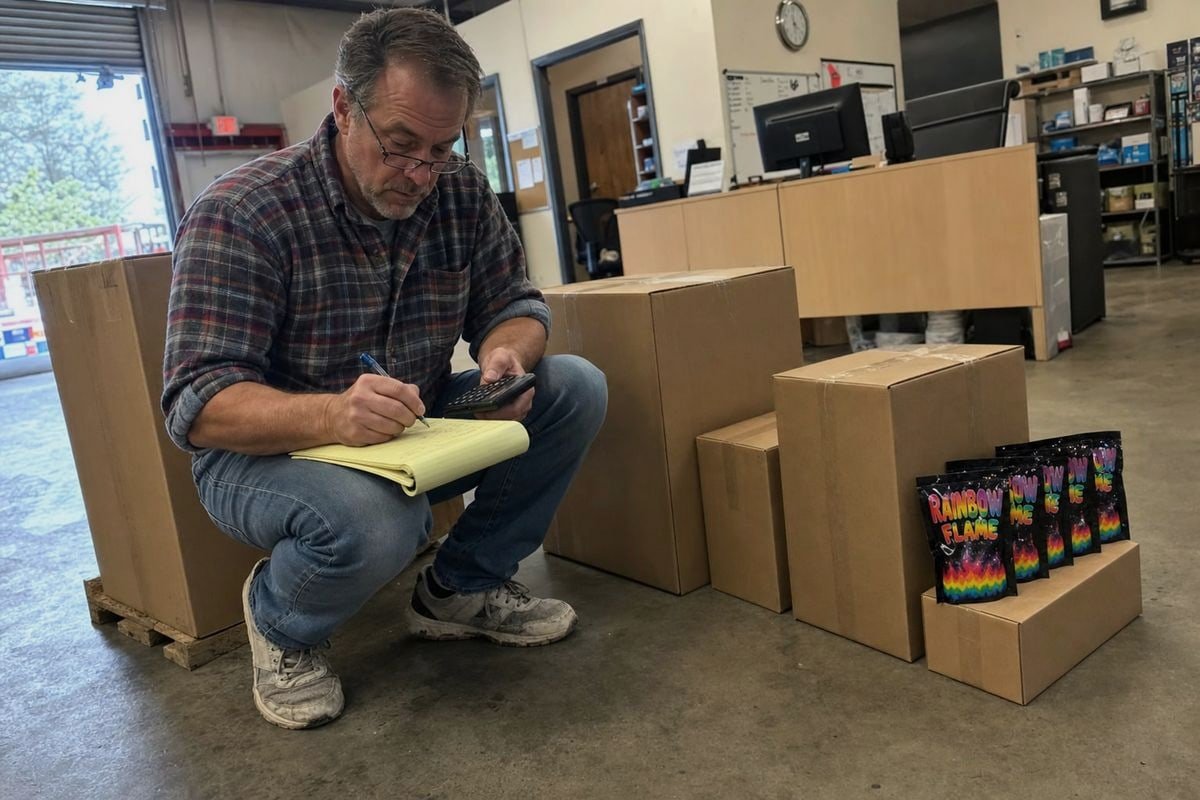
Buyers do not trust a single blended margin number. They want SKU-level profitability at each purchasing tier, because your future costs depend on which tier the new owner will actually order at. If your historical margins came from large-volume pricing but the buyer plans smaller orders, the model must expose that gap.
Start with true landed cost, not invoice price
The formulas are simple. Keep them visible in the workbook:
- Landed cost per unit = (factory purchase cost + freight + duties + inbound handling) ÷ units received
- Gross profit per unit = selling price − landed cost per unit
- Gross Profit Margin % = (selling price − landed cost per unit) ÷ selling price
- Total gross profit = gross profit per unit × units sold
Your landing cost analysis should separate every component. Mixing freight into a lump-sum COGS line, or worse, into operating expenses, distorts everything downstream, including your EBITDA calculation 6 and any Seller's Discretionary Earnings adjustments.
Show the tiers in one comparison table
Here is a simplified illustration of the format buyers respond well to. Use your real numbers, of course:
| MOQ Tier | Unit Factory Cost | Freight & Duty per Unit | Landed Cost | Precio minorista | Gross Margin % |
|---|---|---|---|---|---|
| Trial (small) | Más alto | Higher (LCL) | Más alto | Igual | Más bajo |
| Estándar | Medio | Medio | Medio | Igual | Medio |
| Volume (FCL) | Más bajo | Más bajo | Más bajo | Igual | Más alto |
Do not stop at gross margin
Sophisticated buyers will push past gross margin into contribution margin by channel. Platform fees, fulfillment costs, and returns hit each channel differently. A pouch sold through a marketplace carries different economics than the same pouch sold to a fireplace distributor. Present both views. It signals that you understand your own numbers, which builds trust faster than any pitch deck.
Finally, run a raw-material sensitivity note. Flame-colorant input prices can move. Showing how a swing in base material cost affects each tier's margin proves your margins are understood, not accidental.
What purchasing history and supplier records will build buyer confidence during due diligence?
When our clients ask us for two years of invoice copies before a sale, we know exactly why. Their buyer's diligence team wants to trace every purchase back to a real transaction.
Provide a 24-month purchasing history with supplier invoices reconciled to bank payments, purchase orders matched to batch numbers, supplier certifications and audit reports, documented price changes, and performance records covering lead times, defect rates, and on-time delivery—all tied to your COGS figures.

Purchasing records are where buyers test whether your reported Cost of Goods Sold is real. The standard method is three-way reconciliation: invoice to bank statement, invoice to inventory received, and inventory to units sold. If those three chains hold, your earnings become believable. If they break, everything else gets discounted.
The supplier file buyers want to see
Concentration risk is the quiet deal-killer. If your brand depends on one factory with no documented relationship, the buyer sees fragility. From our side of the table, the clients who present a formal supplier file—signed agreements, our ISO 9001 and BSCI certificates, batch QC records, and a written price history—move through diligence noticeably faster than those who present a folder of emails.
Structure the supplier section like this:
| Registre | What the Buyer Checks | Riesgo si falta |
|---|---|---|
| Supplier agreement / terms | Continuity of supply after the sale | Buyer fears supplier walks away |
| Invoice + payment reconciliation | COGS accuracy | Earnings look inflated |
| Registros de lotes/lotes | Trazabilidad y preparación para retiradas | Product liability exposure |
| Price change log | Margin trend explanations | Margins look unstable |
| Lead time & defect history | Operational reliability | Working capital assumptions break |
Normalize the data before you present it
Clean the purchasing history first. Standardize supplier names, convert currencies consistently, and note any rebates or one-time discounts. Flag anomalies yourself—a delayed shipment, a batch replaced under warranty—with a short written explanation. A seller who surfaces exceptions voluntarily looks trustworthy. A seller whose buyer finds exceptions first looks careless, and diligence slows down while every other number gets re-checked.
Also connect purchasing to working capital requirements. Show typical order-to-delivery cycles and payment terms. Buyers use this to model how much cash the business needs to keep shelves stocked after closing.
How should I structure my due diligence file to highlight consistent quality and lead times?
One lesson our production team learned early: consistency is only worth something if you can prove it on paper. A buyer cannot audit your memory. They can audit your records.
Structure the file as layered tabs—raw invoice data, master SKU list, margin calculations, exception flags, and pivot summaries—then add a quality section with batch QC records, defect rates, and a lead-time log showing promised versus actual delivery dates across 24 months.

The goal of the file structure is speed of verification. A buyer who can answer their own questions in your workbook asks fewer hostile ones. Follow a layered model, keeping raw data separate from calculations:
- Raw data tab: one row per invoice line or order line, untouched.
- Master product tab: one row per SKU with stable attributes—name, category, packaging format (foil pouch, kraft bag, jar, display box), supplier.
- Margin tab: formula-driven unit margin, Gross Profit Margin percentage, and total profit, all traceable to raw data.
- Review tab: flagged outliers, low-margin SKUs, one-time adjustments, and written notes.
- Pivot summary tab: rollups by month, category, supplier, and sales channel.
Prove quality with batch-level evidence
For a color-flame powder brand, consistency means every pouch performs like the first sample. Our factory runs batch-to-batch QC precisely so the trial order matches mass production, and the paper trail from that process is exactly what belongs in your diligence file: incoming inspection records, burn-test logs, defect rates per batch, and any customer complaint history with resolutions. Low, stable defect numbers over two years say more than any marketing claim.
Turn lead times into a chart, not a claim
Log every purchase order with the promised ship date and the actual ship date. Then summarize on-time performance by quarter. Layer in your relación de rotación de inventario 7 by SKU, and separate fast-moving pouches from aging display-box stock. Dead stock matters because a buyer will assume margin-diluting liquidation for anything old. Showing healthy turnover alongside reliable lead times tells the buyer the operation runs itself—which is precisely the story that supports a premium valuation.
Add a short margin bridge as the closing exhibit. Explain each meaningful margin shift over the period: a supplier price change, a freight spike, a new packaging format, a seasonal promotion. Buyers rarely punish explained changes. They always punish unexplained ones.
Conclusión
Clean purchasing and margin data turns a stressful sale into a fast one. Organize costs, certifications, supplier records, and quality logs early, and buyers will trust your numbers.
Notas al pie
1. MSDS is a regulated document type; background reference clarifies its safety compliance purpose. ↩︎
2. Gross Profit Margin is a core financial metric benefiting from a clear conceptual definition. ↩︎
3. Authoritative Wikipedia entry providing a comprehensive overview of the ISO 9001 quality management standard. ↩︎
4. BSCI audit is a specific social compliance program referenced for factory ethical certification. ↩︎
5. CE marking is an EU regulatory requirement referenced for product market access compliance. ↩︎
6. EBITDA is a standard financial term relevant to due diligence and business valuation context. ↩︎
7. Reliable Wikipedia reference explaining the calculation and business significance of inventory turnover ratios. ↩︎



 English
  Spanish
  German
  French
  Arabic
  Portuguese
Únete a la conversación