







يبدو تنظيم بيانات مشتريات مسحوق النار السحري وهوامش الربح أمرًا شاقًا حتى يبدأ فريق العناية الواجبة لدى المشتري في طرح أسئلة سمعها المصنع لدى العملاء يكافحون معها لسنوات وتقارير اختبار إنترتيك، وليس مجرد ادعاء مبيعات. يجب أن يسلمك أي مورد ذي مصداقية 1. الفواتير الفوضوية تقتل الصفقات. البيانات النظيفة تغلقها.
تنظيم بيانات شراء مسحوق Magic Fire وهوامش الربح للعناية الواجبة عن طريق بناء مصنف واحد على مستوى وحدة حفظ المخزون يغطي التكلفة الواصلة، وتكلفة البضائع المباعة، وسعر البيع، والوحدات المباعة، وهامش الربح الإجمالي لكل فترة، مدعومة بفواتير الموردين المتوافقة، وشهادات الامتثال، وسجلات المهلة الموثقة.
هذا هو الجواب المختصر. الآن دعني أرشدك عبر كل جزء، خطوة بخطوة، بناءً على ما نراه يطلبه المشترون فعليًا عندما يستعد عملاؤنا من العلامات التجارية للبيع.
ما هي الشهادات ووثائق الامتثال التي يجب علي تضمينها لتلبية متطلبات العناية الواجبة للمشترين؟
قبل بضع سنوات، كاد أحد عملائنا الموزعين الأوروبيين أن يخسر صفقة بيع علامة تجارية بسبب انتهاء صلاحية تقرير اختبار واحد من SGS في منتصف المفاوضات. أعدنا إصداره في غضون أسابيع، لكن الدرس ظل عالقًا في ذهني.
تضمين شهادات المصنع ISO 9001 و BSCI، وعلامات CE، وتقارير اختبار SGS أو Intertek، وصحائف بيانات سلامة المواد لمسحوق التلوين باللهب، وسجلات الامتثال البيئي الإقليمي، وموافقات ملصقات التحذير، ووثائق الاستيراد - كلها حديثة، ومنظمة حسب SKU، ومتطابقة مع دفعات الإنتاج المحددة.
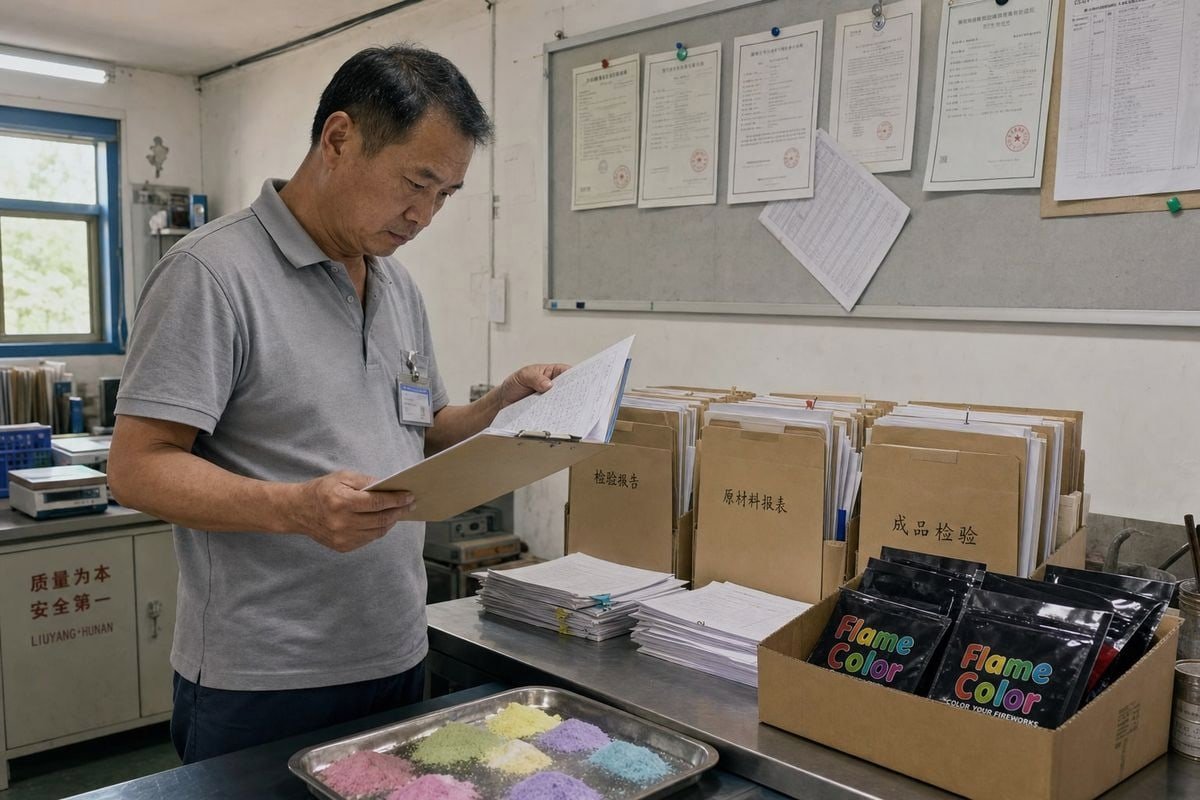
وثائق الامتثال هي أول ما يفتحه المشتري الجاد. لماذا؟ لأن منتج تلوين اللهب المبتكر يقع في فئة منظمة. إذا كانت المستندات مفقودة أو قديمة، يفترض المشتري وجود مسؤولية خفية. هذا الخوف وحده يمكن أن يقلل من تقييمك قبل أن ينظر أي شخص حتى إلى هامش الربح الإجمالي 2.
قم ببناء فهرس امتثال، وليس كومة مجلدات
لا تقم فقط بإسقاط ملفات PDF في محرك أقراص مشترك. قم بإنشاء ورقة فهرس. يسرد كل صف المستند، والهيئة المصدرة، وتاريخ الإصدار، وتاريخ انتهاء الصلاحية، ووحدات SKU التي يغطيها. يحب المشترون هذا لأنه يمكنهم التحقق من التغطية في دقائق.
إليك الهيكل الذي نوصي به لعملائنا ذوي العلامات التجارية الخاصة:
| نوع المستند | الهيئة المصدرة | ما يثبته | دورة التجديد |
|---|---|---|---|
| ISO 9001 3 شهادة | مسجل معتمد | نظام إدارة الجودة في المصنع | كل 3 سنوات، تدقيق سنوي |
| تدقيق BSCI 4 تقرير | مدقق Amfori | الامتثال الاجتماعي والأخلاقي | سنوي |
| مطابقة CE 5 ملف | هيئة معتمدة / إعلان ذاتي | الوصول إلى السوق الأوروبية | لكل تغيير في المنتج |
| تقرير اختبار SGS / Intertek | مختبر طرف ثالث | السلامة الكيميائية، لا توجد مواد ضارة | لكل دفعة أو تغيير في التركيبة |
| صحيفة بيانات السلامة / SDS | الشركة المصنعة | بيانات المناولة والتخزين والمخاطر | عند تغيير التركيبة |
| الموافقة على ملصق التحذير | مراجعة قانونية / تنظيمية | ملصقات سلامة المستهلك | لكل سوق |
ارسم خريطة لحصنك التنظيمي
الامتثال ليس مجرد دفاع. إنه أصل. في أكثر من سبعة عشر عامًا من توريد منتجات تلوين اللهب إلى الولايات المتحدة وألمانيا والمملكة المتحدة وخارجها، رأينا المشترين يدفعون أكثر مقابل العلامات التجارية التي تثبت وثائق سلسلة التوريد الخاصة بها وجود حاجز امتثال لا يمكن للمنافسين نسخه بين عشية وضحاها. وثق أي تركيبات حصرية، أو اتفاقيات علامات تجارية خاصة، أو موافقات خاصة بالسوق. هذه الأوراق هي جزء من حصنك، وهي تنتمي إلى غرفة البيانات في المقدمة وفي المنتصف.
اربط أيضًا كل شهادة بالدفعات التي تغطيها. سيقوم المشتري الذي يختبر جودة الأرباح بالتحقق من الوحدات التي بعتها هل كانت مغطاة بالفعل بتقارير صالحة في وقت البيع.
كيف يمكنني حساب وتقديم بيانات هامش دقيقة عبر مستويات مختلفة من الحد الأدنى لكمية الطلب؟
هناك مقايضة نناقشها مع كل مشترٍ جديد تقريبًا: الحد الأدنى لكميات الطلب الأقل يعني المرونة لطلبات التجربة، ولكن تكلفة الوحدة تتغير، ويجب أن يظهر هذا التغيير بصدق في نموذج الهامش.
احسب هامش الربح لكل مستوى من مستويات الحد الأدنى لكمية الطلب عن طريق حساب التكلفة الإجمالية للوحدة عند كل كمية طلب - سعر المصنع بالإضافة إلى الشحن والرسوم والتعاملات الواردة - ثم اعرض إجمالي الربح لكل وحدة ونسبة هامش الربح الإجمالي جنبًا إلى جنب، حتى يرى المشترون كيف تتغير اقتصاديات الوحدة مع الحجم.
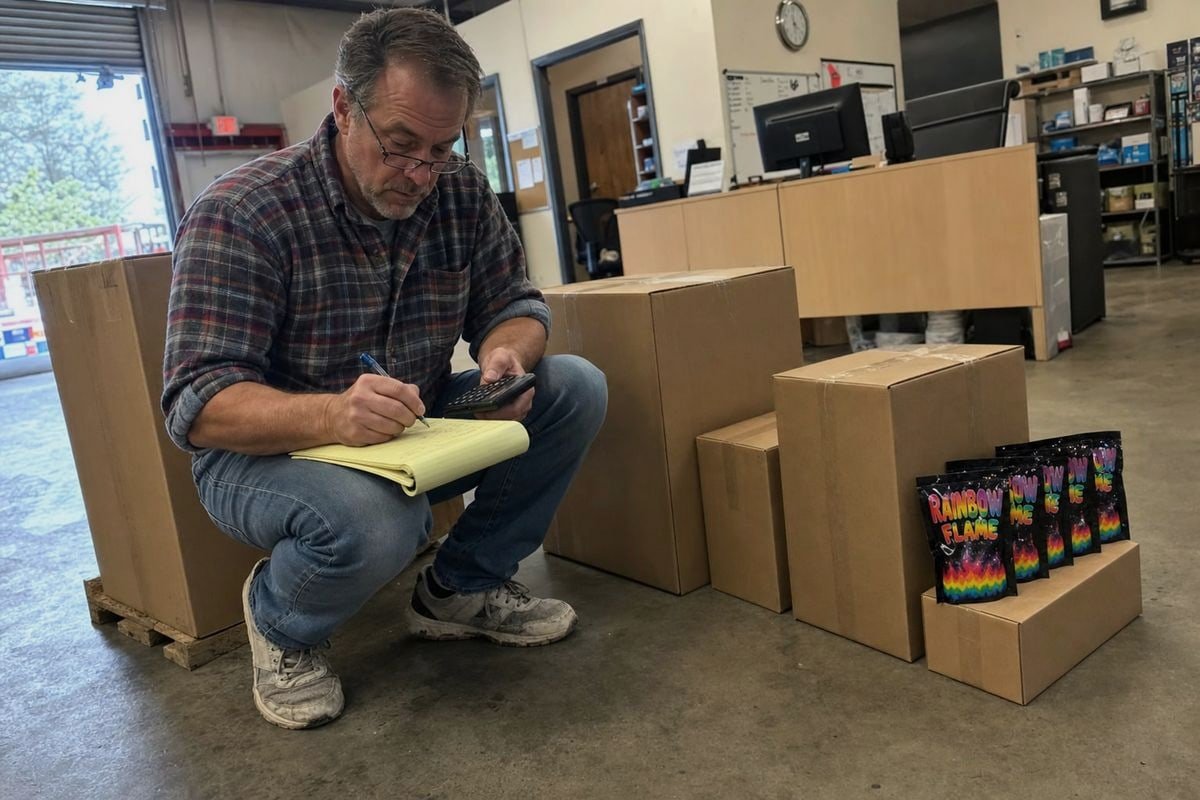
لا يثق المشترون في رقم هامش مدمج واحد. يريدون ربحية على مستوى SKU عند كل مستوى شراء، لأن تكاليفك المستقبلية تعتمد على المستوى الذي سيطلبه المالك الجديد فعليًا. إذا جاءت هوامشك التاريخية من تسعير الكميات الكبيرة ولكن المشتري يخطط لطلبات أصغر، يجب أن يكشف النموذج عن هذه الفجوة.
ابدأ بالتكلفة الحقيقية الواصلة، وليس سعر الفاتورة
الصيغ بسيطة. اجعلها مرئية في المصنف:
- التكلفة الواصلة للوحدة = (تكلفة الشراء من المصنع + الشحن + الرسوم الجمركية + مناولة الاستلام) ÷ الوحدات المستلمة
- الربح الإجمالي للوحدة = سعر البيع - التكلفة الواصلة للوحدة
- هامش الربح الإجمالي % = (سعر البيع - التكلفة الواصلة للوحدة) ÷ سعر البيع
- إجمالي الربح الإجمالي = الربح الإجمالي للوحدة × الوحدات المباعة
يجب أن يفصل تحليل تكلفة الوصول الخاصة بك كل مكون. خلط الشحن في سطر تكلفة البضائع المباعة بمبلغ مقطوع، أو ما هو أسوأ، في المصاريف التشغيلية، يشوه كل شيء لاحقًا، بما في ذلك حساب الأرباح قبل الفوائد والضرائب والإهلاك والاستهلاك 6 وأي تعديلات على أرباح البائع التقديرية.
اعرض المستويات في جدول مقارنة واحد
Here is a simplified illustration of the format buyers respond well to. Use your real numbers, of course:
| MOQ Tier | Unit Factory Cost | Freight & Duty per Unit | Landed Cost | سعر البيع بالتجزئة | Gross Margin % |
|---|---|---|---|---|---|
| Trial (small) | أعلى | Higher (LCL) | الأعلى | نفس الشيء | الأدنى |
| قياسي | متوسط | متوسط | متوسط | نفس الشيء | متوسط |
| Volume (FCL) | الأدنى | الأدنى | الأدنى | نفس الشيء | الأعلى |
Do not stop at gross margin
Sophisticated buyers will push past gross margin into contribution margin by channel. Platform fees, fulfillment costs, and returns hit each channel differently. A pouch sold through a marketplace carries different economics than the same pouch sold to a fireplace distributor. Present both views. It signals that you understand your own numbers, which builds trust faster than any pitch deck.
Finally, run a raw-material sensitivity note. Flame-colorant input prices can move. Showing how a swing in base material cost affects each tier's margin proves your margins are understood, not accidental.
ما هو سجل الشراء وسجلات المورد التي ستبني ثقة المشتري أثناء العناية الواجبة؟
When our clients ask us for two years of invoice copies before a sale, we know exactly why. Their buyer's diligence team wants to trace every purchase back to a real transaction.
قدم سجل مشتريات لمدة 24 شهرًا مع فواتير الموردين التي تمت مطابقتها مع مدفوعات البنك، وأوامر الشراء المطابقة لأرقام الدُفعات، وشهادات الموردين وتقارير التدقيق، وتغيرات الأسعار الموثقة، وسجلات الأداء التي تغطي أوقات التسليم، ومعدلات العيوب، والتسليم في الوقت المحدد - وكلها مرتبطة بأرقام تكلفة البضائع المباعة الخاصة بك.

Purchasing records are where buyers test whether your reported Cost of Goods Sold is real. The standard method is three-way reconciliation: invoice to bank statement, invoice to inventory received, and inventory to units sold. If those three chains hold, your earnings become believable. If they break, everything else gets discounted.
The supplier file buyers want to see
Concentration risk is the quiet deal-killer. If your brand depends on one factory with no documented relationship, the buyer sees fragility. From our side of the table, the clients who present a formal supplier file—signed agreements, our ISO 9001 and BSCI certificates, batch QC records, and a written price history—move through diligence noticeably faster than those who present a folder of emails.
Structure the supplier section like this:
| سجل | What the Buyer Checks | المخاطر في حالة الفقدان |
|---|---|---|
| Supplier agreement / terms | Continuity of supply after the sale | Buyer fears supplier walks away |
| Invoice + payment reconciliation | COGS accuracy | Earnings look inflated |
| سجلات الدُفعات / الدُفعات | التتبع والاستعداد للاستدعاء | Product liability exposure |
| Price change log | Margin trend explanations | Margins look unstable |
| Lead time & defect history | Operational reliability | Working capital assumptions break |
Normalize the data before you present it
Clean the purchasing history first. Standardize supplier names, convert currencies consistently, and note any rebates or one-time discounts. Flag anomalies yourself—a delayed shipment, a batch replaced under warranty—with a short written explanation. A seller who surfaces exceptions voluntarily looks trustworthy. A seller whose buyer finds exceptions first looks careless, and diligence slows down while every other number gets re-checked.
Also connect purchasing to working capital requirements. Show typical order-to-delivery cycles and payment terms. Buyers use this to model how much cash the business needs to keep shelves stocked after closing.
كيف يجب أن أنظم ملف العناية الواجبة الخاص بي لتسليط الضوء على الجودة المتسقة وأوقات التسليم؟
One lesson our production team learned early: consistency is only worth something if you can prove it on paper. A buyer cannot audit your memory. They can audit your records.
قم بتنظيم الملف كعلامات تبويب متراكبة - بيانات الفواتير الأولية، وقائمة وحدات حفظ المخزون الرئيسية، وحسابات الهامش، وعلامات الاستثناء، وملخصات المحور - ثم أضف قسمًا للجودة بسجلات مراقبة الجودة الدفعية، ومعدلات العيوب، وسجل المهلة الزمنية الذي يوضح تواريخ التسليم الموعودة مقابل الفعلية عبر 24 شهرًا.

The goal of the file structure is speed of verification. A buyer who can answer their own questions in your workbook asks fewer hostile ones. Follow a layered model, keeping raw data separate from calculations:
- Raw data tab: one row per invoice line or order line, untouched.
- Master product tab: one row per SKU with stable attributes—name, category, packaging format (foil pouch, kraft bag, jar, display box), supplier.
- Margin tab: formula-driven unit margin, Gross Profit Margin percentage, and total profit, all traceable to raw data.
- Review tab: flagged outliers, low-margin SKUs, one-time adjustments, and written notes.
- Pivot summary tab: rollups by month, category, supplier, and sales channel.
Prove quality with batch-level evidence
For a color-flame powder brand, consistency means every pouch performs like the first sample. Our factory runs batch-to-batch QC precisely so the trial order matches mass production, and the paper trail from that process is exactly what belongs in your diligence file: incoming inspection records, burn-test logs, defect rates per batch, and any customer complaint history with resolutions. Low, stable defect numbers over two years say more than any marketing claim.
Turn lead times into a chart, not a claim
Log every purchase order with the promised ship date and the actual ship date. Then summarize on-time performance by quarter. Layer in your نسبة دوران المخزون 7 by SKU, and separate fast-moving pouches from aging display-box stock. Dead stock matters because a buyer will assume margin-diluting liquidation for anything old. Showing healthy turnover alongside reliable lead times tells the buyer the operation runs itself—which is precisely the story that supports a premium valuation.
Add a short margin bridge as the closing exhibit. Explain each meaningful margin shift over the period: a supplier price change, a freight spike, a new packaging format, a seasonal promotion. Buyers rarely punish explained changes. They always punish unexplained ones.
خاتمة
Clean purchasing and margin data turns a stressful sale into a fast one. Organize costs, certifications, supplier records, and quality logs early, and buyers will trust your numbers.
ملاحظات ختامية
1. MSDS is a regulated document type; background reference clarifies its safety compliance purpose. ↩︎
2. Gross Profit Margin is a core financial metric benefiting from a clear conceptual definition. ↩︎
3. Authoritative Wikipedia entry providing a comprehensive overview of the ISO 9001 quality management standard. ↩︎
4. BSCI audit is a specific social compliance program referenced for factory ethical certification. ↩︎
5. CE marking is an EU regulatory requirement referenced for product market access compliance. ↩︎
6. EBITDA is a standard financial term relevant to due diligence and business valuation context. ↩︎
7. Reliable Wikipedia reference explaining the calculation and business significance of inventory turnover ratios. ↩︎



 English
  Spanish
  German
  French
  Arabic
  Portuguese
انضم إلى المحادثة