







Los compradores me preguntan constantemente por los costos de los nuevos moldes de Magic Fire Powder. Temen pagar miles por adelantado por herramientas que nunca se amortizan. En nuestra línea de producción, he visto cómo ese miedo ha matado buenas ofertas, y también he visto cómo un simple cálculo de retorno de la inversión ha convertido la duda en una orden de compra segura.
Calcula el retorno de la inversión dividiendo el costo total del molde de Polvo Mágico de Fuego por tus ahorros anuales de entrega. Si un molde de $3,000 ahorra $4.00 por pedido en envío y manipulación, el punto de equilibrio es de 750 pedidos. Con 1,000 pedidos por año, el retorno de la inversión llega en unos nueve meses.
Esa fórmula parece simple. La parte difícil es completar los números honestamente. A continuación, detallo cada variable paso a paso, utilizando rangos de herramientas reales y escenarios logísticos de nuestro trabajo de exportación.
¿Cómo calculo el volumen de pedido de punto de equilibrio necesario para compensar la inversión en un nuevo molde?
Un distribuidor alemán me envió una vez una hoja de cálculo con una celda en blanco: volumen de punto de equilibrio. Nuestro equipo la completó juntos en una videollamada, y el pedido se cerró esa semana.
Divide la inversión total del molde por el ahorro neto por pedido. Volumen de equilibrio = costo del molde ÷ (ahorro de entrega por pedido - costos adicionales por pedido). Un molde de $3,000 con un ahorro neto de $4.00 por pedido alcanza el punto de equilibrio exactamente en 750 pedidos, independientemente del plazo.
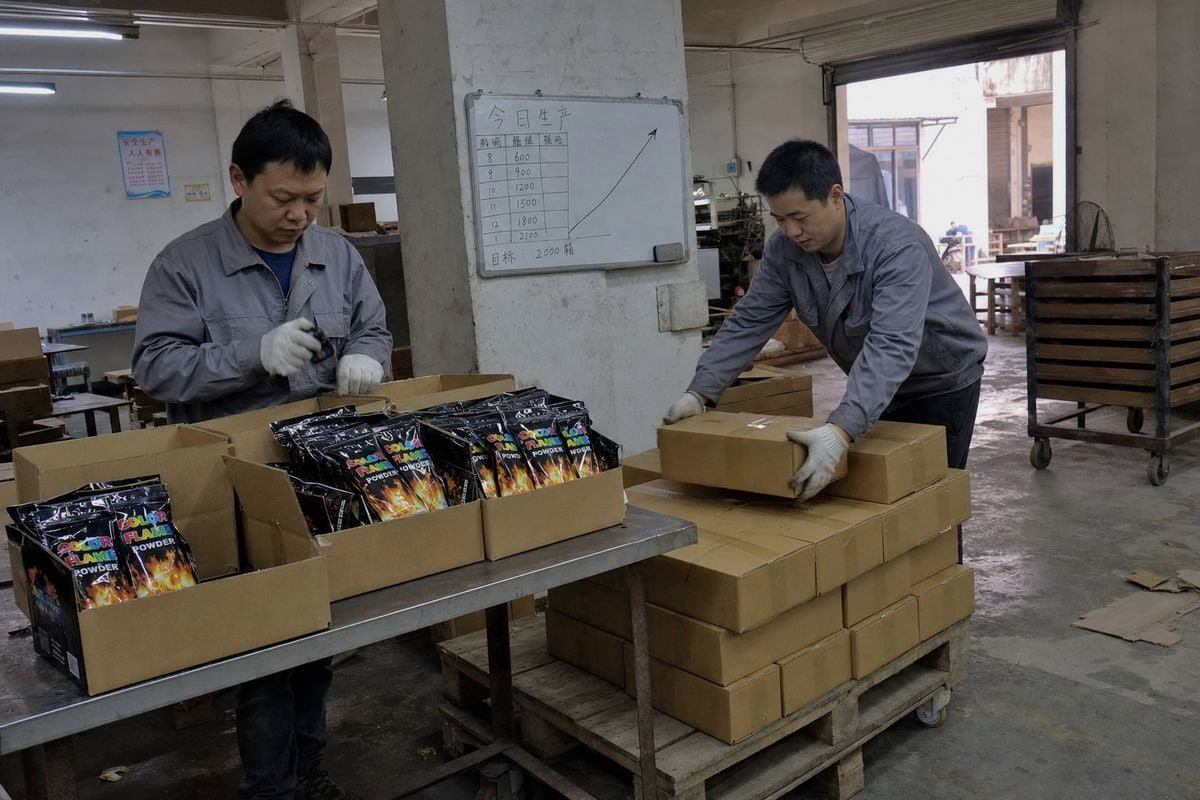
Análisis del punto de equilibrio es la base de cada decisión de herramientas que ayudamos a los compradores a tomar. Las matemáticas en sí mismas toman treinta segundos. Obtener datos honestos lleva más tiempo, así que déjame desglosar cada variable.
Los cuatro números que necesitas
Primero, el costo del molde (C). Esto incluye diseño, herramientas, configuración e iteraciones de muestras, no solo el precio cotizado de la herramienta. Segundo, ahorros por pedido (S). Este es el costo de entrega o cumplimiento que evita con el nuevo embalaje. Tercero, volumen anual de pedidos (N). Utilice su pronóstico conservador, no el de su mejor escenario. Cuarto, costos anuales relacionados con el molde (M), como mantenimiento, limpieza y almacenamiento.
La fórmula completa se ve así:
- Ahorros netos anuales = (N × S) − M
- Meses de retorno = 12 × C ÷ ahorros netos anuales
- Volumen de punto de equilibrio = C ÷ ahorros netos por pedido
Si N × S es menor o igual a M, el molde nunca se amortiza. Esa única comprobación ha evitado que varios de nuestros compradores más pequeños tomen una mala decisión de gasto de capital (CapEx).
Ejemplo práctico con tres volúmenes
| Escenario | Costo del molde | Ahorro por pedido | Pedidos anuales | Tiempo de retorno |
|---|---|---|---|---|
| Bajo volumen | $3,000 | $4.00 | 250 | 3 años |
| Volumen medio | $3,000 | $4.00 | 750 | 12 meses |
| Alto volumen | $3,000 | $4.00 | 1,000 | ~9 meses |
Observe cómo el retorno no es lineal. Duplicar el volumen de 250 a 500 pedidos reduce el retorno a la mitad. Esta sensibilidad del volumen-velocidad es la razón por la que siempre pedimos a los compradores requisitos de volumen de producción realistas 1 antes de cotizar herramientas personalizadas. Un aumento moderado de las ventas acelera desproporcionadamente el retorno de la inversión (ROI) porque el costo fijo se distribuye entre más unidades.
Una advertencia más. Los pequeños errores de pronóstico se acumulan. Si sus 1000 pedidos proyectados resultan ser 400, su retorno de nueve meses se convierte en más de dos años. Recomendamos ejecutar el cálculo al 60%, 100% y 140% del pronóstico antes de comprometerse.
¿Qué costos de moldes y herramientas debo esperar al personalizar el empaque de Magic Fire Powder?
Cotizar herramientas es un compromiso que evalúo cada semana: una herramienta de aluminio de bajo costo permite al comprador llegar al mercado rápidamente, mientras que un molde de producción endurecido reduce el costo unitario pero exige un volumen mucho mayor para justificarse.
Espere aproximadamente $1.000–$5.000 para moldes de embalaje sencillos, como utillaje para tarros o sobres personalizados, $2.000–$5.000 para moldes prototipo o de puente de aluminio, y $5.000–$100.000+ para utillaje complejo de acero de grado de producción. La complejidad, el número de cavidades y el material del molde impulsan el precio final.
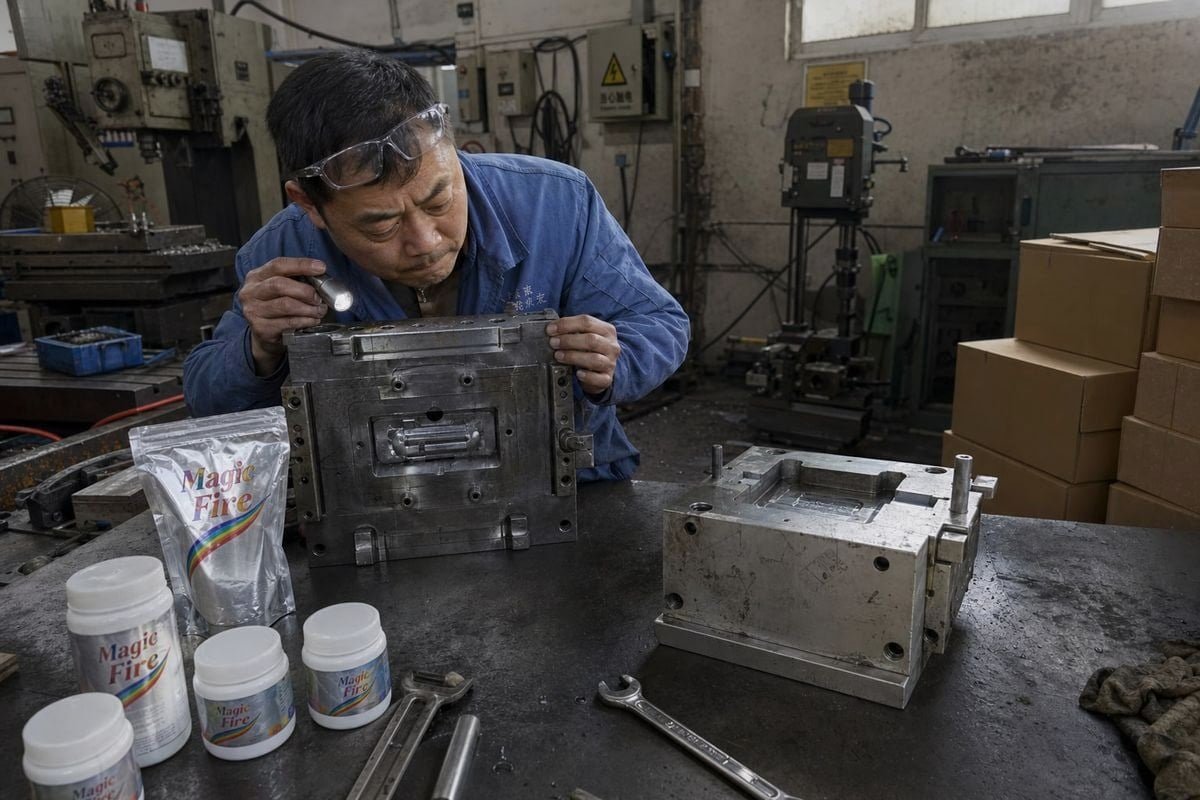
El costo de las herramientas es el mayor insumo fijo en su fórmula de retorno de la inversión, por lo que vale la pena entender qué está comprando realmente. Cuando desarrollamos empaques personalizados para nuestros paquetes de llama de color —sobres de papel de aluminio, bolsas de pie de kraft o frascos de plástico— la pila de herramientas tiene varias capas que los compradores primerizos a menudo pasan por alto.
La pila de costos completa, no solo la herramienta
El precio cotizado del molde rara vez lo cubre todo. Esto es lo que detallamos para los compradores antes de que firmen:
| Artículo de costo | Rango Típico | ¿A menudo pasado por alto? |
|---|---|---|
| Diseño e ingeniería del molde | $300–$1,500 | A veces |
| Fabricación del núcleo de la herramienta | $1,000–$12,000+ | No |
| Muestras y ejecuciones de iteración | $200–$800 | Sí |
| Configuración e inspección de la primera pieza | $150–$500 | Sí |
| Mantenimiento y almacenamiento anual | $100–$500/año | Casi siempre |
La amortización de las herramientas es cómo traduce esto en la economía unitaria. Divida la inversión total en herramientas 2 por la producción esperada de por vida. Un molde de $4,000 que produce 200,000 sobres a lo largo de su vida añade solo $0.02 por unidad. Ese es el "impuesto de utillaje", y cuando es menor que el ahorro de entrega por unidad, la inversión se autofinancia.
El tipo de molde cambia la ecuación
Los moldes de bajo costo se amortizan rápidamente pero se desgastan más rápido. Una herramienta de aluminio blando puede manejar decenas de miles de ciclos; el acero endurecido maneja millones. En nuestra experiencia exportando a más de 30 países, el camino más inteligente para una demanda incierta es primero el utillaje de puente, luego el utillaje de producción. Validas el mercado con una herramienta de aluminio de $2,000–$5,000, luego actualizas una vez que los datos reales de pedidos reemplazan las conjeturas. Ese enfoque de "probar primero, escalar después" protege tu CapEx y mantiene costo total de propiedad (TCO) 3 visible desde el primer día.
Una nota honesta de nuestro taller: la consistencia lote a lote importa tanto como el molde en sí. Una herramienta bien construida operada bajo un estricto control de calidad significa que tu primera muestra refleja genuinamente la producción en masa, lo que mantiene válidas tus suposiciones de recuperación.
¿Cuánto pueden ahorrarme realmente los moldes de embalaje personalizados en envío y logística con el tiempo?
Una marca canadiense de camping me mostró una vez sus facturas de flete antes y después de cambiar de un frasco voluminoso a nuestro formato de sobre anidado. La diferencia fue mayor de lo que cualquiera de nosotros había predicho.
Los moldes personalizados suelen reducir los costos de envío 15-40% mediante un embalaje más denso, un menor peso dimensional, una mejor utilización del palé y menos envíos parciales. Los diseños centrados en el recambio —un frasco maestro duradero más bolsas de recambio ligeras— pueden reducir el volumen de envío a largo plazo hasta en un 40%.

Los ahorros en la entrega son donde la historia de la recuperación se gana o se pierde, y provienen de más fuentes de las que la mayoría de los compradores esperan. Cuando optimizamos el embalaje para la exportación, consideramos cinco canales de ahorro distintos.
De dónde provienen los ahorros reales
Utilización del cubo y peso DIM. Las empresas de transporte cobran por peso dimensional 4, no solo por el peso real. Un molde diseñado para anidar o apilar permite colocar más unidades por caja y más cajas por palé. Una mejor utilización del cubo reduce directamente el costo de flete por unidad, esto es optimización de la cadena de suministro 5 en su forma más concreta.
Consolidación de fletes. Un embalaje más denso significa que un año completo de stock puede caber en menos contenedores. Combinado con la agrupación estacional (producir inventario de temporada alta durante los meses de temporada baja), los compradores reemplazan múltiples y costosas reposiciones de carga aérea con un solo envío marítimo antes de la temporada de camping. Programamos exactamente este tipo de producción para varios distribuidores europeos cada primavera.
Menos roturas y devoluciones. El grosor reforzado de la pared y el sellado adecuado reducen las reclamaciones por fugas y daños. Cada reembolso evitado es un ahorro que tu modelo de recuperación debe capturar.
Ingeniería SIOC. Si el embalaje primario es lo suficientemente duradero como para enviarse en su propio contenedor, eliminas por completo el embalaje secundario. Eso elimina el costo de material, la mano de obra de embalaje y el peso de la última milla en un solo movimiento.
Estrategia de recarga. Pasar de sobres de un solo uso a un frasco principal más bolsas de recarga planas reduce drásticamente el volumen de envíos repetidos.
| Fuente de ahorro | Cambios en la formulación de la cera | Mejor para |
|---|---|---|
| Reducción del peso DIM | 10–25% de reducción de flete | Vendedores de paquetería/comercio electrónico |
| Consolidación de fletes | Menos envíos, más baratos | Compradores mayoristas de temporada |
| Embalaje SIOC | Elimina el embalaje excesivo | Canales de Amazon/minoristas |
| Modelo de bolsa de recarga | Hasta 40% de reducción de volumen | Marcas de compra repetida |
Una nota de cumplimiento de nuestra parte: debido a que nuestros productos de color llama están hechos de materiales ecológicos sin químicos dañinos, y se envían con informes de prueba SGS/Intertek, los compradores evitan los recargos de transportistas especializados que plagan los productos contra incendios mal documentados. La documentación limpia es en sí misma un ahorro logístico. No olvides los costos de mantenimiento de inventario tampoco: un embalaje más denso significa menos espacio de almacén por unidad, lo que mejora silenciosamente tu TCO año tras año.
¿Cuál es un plazo de amortización realista antes de comprometerme con un nuevo molde con mi fabricante?
Diecisiete años de proyectos OEM nos han enseñado una lección por encima de todo: los compradores que establecen un techo de recuperación antes de pedir utillaje casi nunca se arrepienten de la inversión después.
Un plazo de recuperación realista para los moldes de envasado de Magic Fire Powder es de 6 a 18 meses para marcas establecidas con un volumen constante, y de 18 a 36 meses para lanzamientos de nuevos productos. Si las proyecciones muestran un retorno de la inversión superior a tres años, retrase la inversión o comience con herramientas provisionales más baratas en su lugar.
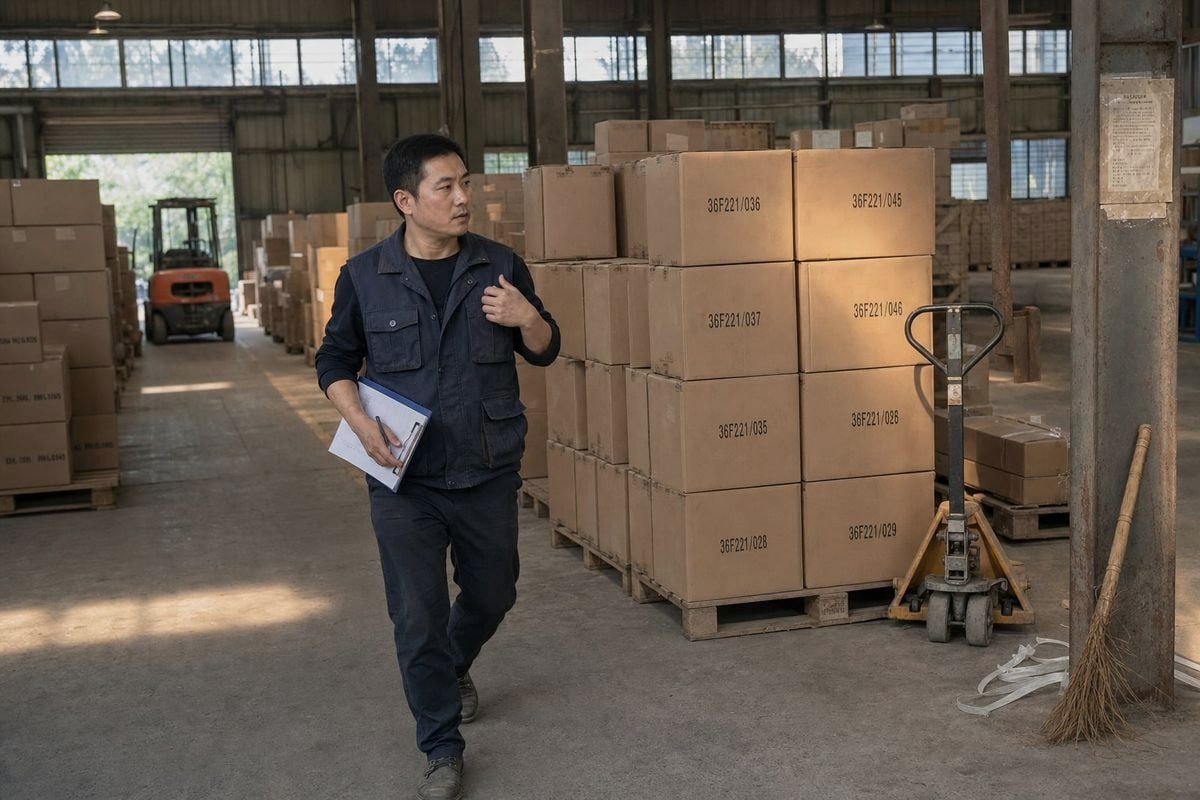
Los plazos importan porque el dinero del utillaje es capital comprometido. Cada dólar en un molde es un dólar no disponible para inventario, marketing u otros proyectos de eficiencia. Es por eso que el costo de oportunidad 6 pertenece a esta decisión. Antes de aprobar el utillaje, compara su tasa interna de retorno 7 con tu mejor uso alternativo del mismo capital. Un molde que se amortiza en nueve meses generalmente supera la mayoría de las alternativas; uno que se amortiza en cuatro años generalmente no lo hace.
Un marco de decisión que guiamos a los compradores
- Pronostica de forma conservadora. Utiliza tu peor volumen anual creíble, no tu objetivo.
- Ejecuta tres escenarios. Calcula la recuperación con volumen bajo, esperado y alto.
- Agrega los costos del ciclo de vida. Incluye la limpieza del molde, el almacenamiento y las posibles reparaciones de cavidades en la cifra de inversión. Omitir esto es la forma más común en que los compradores subestiman el tiempo real de recuperación.
- Set a ceiling. Most of our long-term partners use 18–24 months as their maximum acceptable payback.
- Choose the tooling tier that fits. Uncertain demand points to bridge tooling; proven demand justifies production-grade steel.
When to say no — and the counterargument
Let me raise the objection skeptical buyers put to me directly: what if demand is seasonal or the design changes before the mold recoups its cost? It is a fair concern. Color-flame products do peak around camping season and winter holidays. Our answer is the hybrid path — start with the cheapest workable mold, validate real sell-through for one or two seasons, then commit to production tooling with actual data. That converts a speculative CapEx bet into a staged, evidence-based unit cost reduction plan.
The pro-investment case remains strong when volume is stable: mold ownership steadily compresses per-order costs and improves margin. The skeptical case wins when volume is thin or volatile. The framework above tells you which camp you are in — before the deposit leaves your account.
Conclusión
Mold payback is not about the sticker price. Compare Magic Fire Powder tooling cost against real delivery savings, run three volume scenarios, cap your timeline — then commit with confidence.
Notas al pie
1. NIST guidance on aligning production planning with manufacturing strategy and volume requirements. ↩︎
2. Highly stable and authoritative overview of tooling costs and engineering. ↩︎
3. Comprehensive overview of TCO as a financial estimate for determining direct and indirect costs. ↩︎
4. Official carrier guidelines on how package volume influences shipping rates via dimensional weight calculations. ↩︎
5. Industry leader's explanation of optimizing supply chains to reduce costs and improve delivery performance. ↩︎
6. Economic concept explaining the value of the next-best alternative foregone when making a decision. ↩︎
7. Standard authoritative financial definition for investment analysis. ↩︎


 English
  Spanish
  German
  French
  Arabic
  Portuguese
Únete a la conversación