







Les acheteurs me posent constamment des questions sur les coûts des nouveaux moules pour la poudre Magic Fire. Ils craignent de payer des milliers d'euros d'avance pour des outillages qui ne sont jamais rentables. Sur notre chaîne de production, j'ai vu cette peur faire échouer de bonnes affaires — et j'ai aussi vu un simple calcul de retour sur investissement transformer l'hésitation en un bon de commande confiant.
Calculez le retour sur investissement en divisant le coût total du moule de Poudre de Feu Magique par vos économies annuelles de livraison. Si un moule de $3 000 permet d'économiser $4,00 par commande en frais de port et de manutention, le seuil de rentabilité est de 750 commandes. À 1 000 commandes par an, le retour sur investissement arrive en environ neuf mois.
Cette formule semble simple. La partie difficile est de remplir les chiffres honnêtement. Ci-dessous, je détaille chaque variable étape par étape, en utilisant des fourchettes d'outillage réelles et des scénarios logistiques de notre travail à l'export.
Comment calculer le volume de commande de rentabilité nécessaire pour compenser un nouvel investissement dans un moule ?
Un distributeur allemand m'a un jour envoyé une feuille de calcul avec une cellule vide : le volume de seuil de rentabilité. Notre équipe l'a remplie ensemble lors d'un appel vidéo, et la commande a été conclue cette semaine-là.
Divisez l'investissement total dans le moule par les économies nettes par commande. Volume de rentabilité = coût du moule ÷ (économies de livraison par commande − coûts supplémentaires par commande). Un moule de $3 000 avec une économie nette de $4,00 par commande atteint le seuil de rentabilité à exactement 750 commandes, quelle que soit la période.
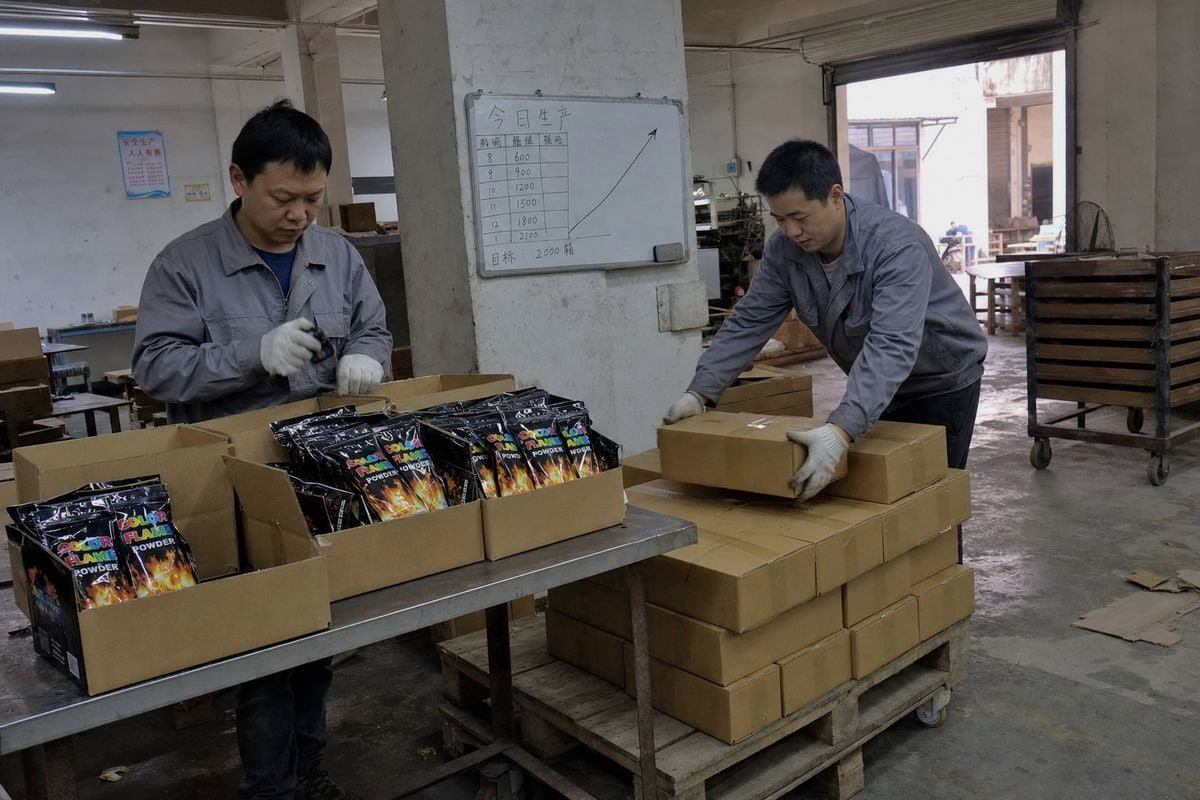
Analyse du point mort est la base de chaque décision d'outillage que nous aidons les acheteurs à prendre. Le calcul lui-même prend trente secondes. Obtenir des données honnêtes prend plus de temps, alors laissez-moi décomposer chaque variable.
Les quatre chiffres dont vous avez besoin
Premièrement, le coût du moule (C). Cela comprend la conception, l'outillage, l'installation et les itérations d'échantillons — pas seulement le prix de l'outil indiqué. Deuxièmement, les économies par commande (S). Il s'agit du coût de livraison ou d'exécution que vous évitez avec le nouvel emballage. Troisièmement, le volume annuel des commandes (N). Utilisez votre prévision conservatrice, pas votre meilleure estimation. Quatrièmement, les coûts annuels liés au moule (M), tels que la maintenance, le nettoyage et le stockage.
La formule complète ressemble à ceci :
- Économies nettes annuelles = (N × S) − M
- Mois de retour sur investissement = 12 × C ÷ économies nettes annuelles
- Volume de seuil de rentabilité = C ÷ économies nettes par commande
Si N × S est inférieur ou égal à M, le moule ne sera jamais rentable. Cette seule vérification a évité à plusieurs de nos plus petits acheteurs une mauvaise décision de dépense d'investissement (CapEx).
Exemple concret à trois volumes
| Scénario | Coût du moule | Économies/Commande | Commandes annuelles | Temps de retour sur investissement |
|---|---|---|---|---|
| Faible volume | $3,000 | $4.00 | 250 | 3 ans |
| Volume moyen | $3,000 | $4.00 | 750 | 12 mois |
| Volume élevé | $3,000 | $4.00 | 1,000 | ~9 mois |
Remarquez comment le retour sur investissement n'est pas linéaire. Doubler le volume de 250 à 500 commandes réduit le retour sur investissement de moitié. Cette sensibilité volume-vitesse est la raison pour laquelle nous demandons toujours aux acheteurs leurs exigences de volume de production réalistes 1 avant de deviser des outillages personnalisés. Une augmentation modérée des ventes accélère de manière disproportionnée le retour sur investissement (ROI) car le coût fixe est réparti sur plus d'unités.
Une autre mise en garde. Les petites erreurs de prévision s'accumulent. Si vos 1 000 commandes prévues s'avèrent être 400, votre retour sur investissement de neuf mois devient plus de deux ans. Nous recommandons d'exécuter le calcul à 60%, 100% et 140% de la prévision avant de s'engager.
À quels coûts de moule et d'outillage dois-je m'attendre lors de la personnalisation des emballages de poudre Magic Fire ?
L'établissement des prix des outillages est un compromis que j'évalue chaque semaine : un outil en aluminium à faible coût permet à un acheteur d'accéder rapidement au marché, tandis qu'un moule de production durci réduit le coût unitaire mais exige un volume beaucoup plus important pour être justifié.
Attendez-vous à environ $1 000–$5 000 pour des moules d'emballage simples tels que des outils personnalisés pour bocaux ou sachets, $2 000–$5 000 pour des moules prototypes ou de pont en aluminium, et $5 000–$100 000+ pour des outillages complexes en acier de qualité production. La complexité, le nombre de cavités et le matériau du moule déterminent le prix final.
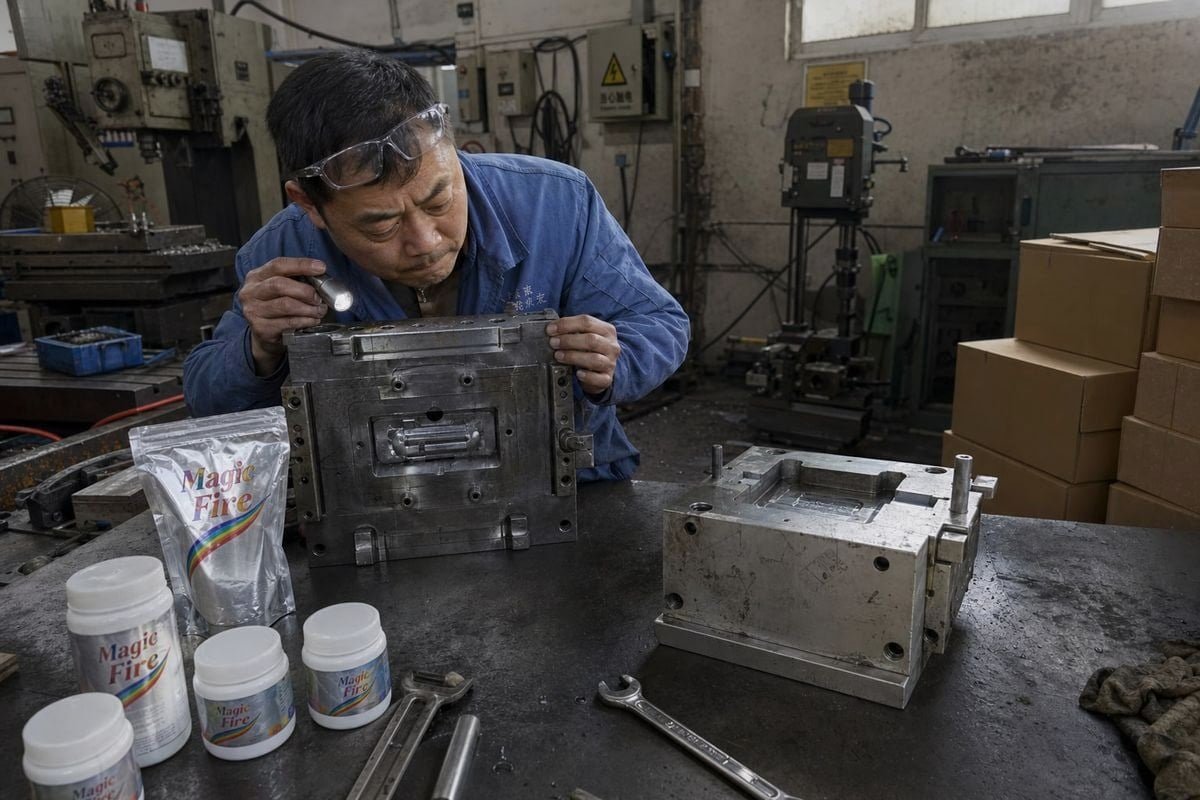
Le coût de l'outillage est le principal intrant fixe dans votre formule de retour sur investissement, il est donc utile de comprendre ce que vous achetez réellement. Lorsque nous développons des emballages personnalisés pour nos sachets de flammes colorées — sachets en aluminium, pochettes à fermeture éclair en kraft ou pots en plastique — la pile d'outillage comporte plusieurs couches que les acheteurs novices manquent souvent.
La pile de coûts complète, pas seulement l'outil
Le prix du moule indiqué couvre rarement tout. Voici ce que nous détaillons pour les acheteurs avant qu'ils ne signent :
| Article de coût | Fourchette typique | Souvent négligé ? |
|---|---|---|
| Conception et ingénierie du moule | 300 €–1 500 € | Parfois |
| Fabrication de l'outillage principal | 1 000 €–12 000 €+ | Non |
| Essais d'échantillons et itérations | 200 €–800 € | Oui |
| Installation et inspection de la première pièce | 150 €–500 € | Oui |
| Maintenance et stockage annuels | 100 €–500 €/an | Presque toujours |
L'amortissement de l'outillage est la façon dont vous traduisez cela en économie unitaire. Divisez l' investissement total en outillage 2 par la durée de vie attendue. Un moule de 4 000 € produisant 200 000 sachets au cours de sa vie ajoute seulement 0,02 € par unité. C'est la "taxe d'outillage" — et lorsqu'elle est inférieure à l'économie de livraison par unité, l'investissement se justifie.
Mold type changes the equation
Low-cost molds pay back quickly but wear faster. A soft aluminum tool may handle tens of thousands of cycles; hardened steel handles millions. In our experience exporting to 30+ countries, the smartest path for uncertain demand is bridge tooling first, production tooling later. You validate the market with a $2,000–$5,000 aluminum tool, then upgrade once real order data replaces guesswork. That "test first, scale later" approach protects your CapEx and keeps coût total de possession (CTP) 3 visible from day one.
One honest note from our factory floor: batch-to-batch consistency matters as much as the mold itself. A well-built tool run under strict quality control means your first sample genuinely reflects mass production — which keeps your payback assumptions valid.
Combien de moules d'emballage personnalisés peuvent réellement me faire économiser sur l'expédition et la logistique au fil du temps ?
A Canadian camping brand once showed me their freight invoices before and after switching from a bulky jar to our nested sachet format. The difference was larger than either of us had predicted.
Les moules personnalisés réduisent généralement les coûts d'expédition de 15 à 40 % grâce à un emballage plus dense, un poids dimensionnel inférieur, une meilleure utilisation des palettes et moins d'expéditions fractionnées. Les conceptions axées sur le remplissage — un bocal maître durable plus des sachets de recharge légers — peuvent réduire le volume d'expédition à long terme jusqu'à 40 %.

Delivery savings are where the payback story is won or lost, and they come from more sources than most buyers expect. When we optimize packaging for export, we look at five distinct savings channels.
D'où viennent les économies réelles
Cube utilization and DIM weight. Carriers charge on le poids dimensionnel 4, not just actual weight. A mold designed for nesting or stackability puts more units per carton and more cartons per pallet. Better cube utilization directly lowers freight cost per unit — this is l'optimisation de la chaîne d'approvisionnement 5 at its most concrete.
Freight consolidation. Denser packaging means a full year of stock can fit into fewer containers. Combined with seasonal batching — producing peak-season inventory during off-peak months — buyers replace multiple expensive air-freight restocks with one sea-freight shipment before camping season. We schedule exactly this kind of run for several European distributors each spring.
Fewer breakages and returns. Reinforced wall thickness and proper sealing reduce leakage and damage claims. Every avoided refund is a saving your payback model should capture.
SIOC engineering. If the primary packaging is durable enough to ship in its own container, you eliminate secondary over-boxing entirely. That removes material cost, packing labor, and final-mile weight in one move.
Refill strategy. Shifting from single-use sachets to a master jar plus flat refill pouches slashes repeat-shipment volume dramatically.
| Savings Source | Impact typique | Idéal pour |
|---|---|---|
| DIM weight reduction | 10–25% freight cut | Parcel/e-commerce sellers |
| Consolidation du fret | Fewer, cheaper shipments | Seasonal wholesale buyers |
| SIOC packaging | Eliminates over-boxing | Amazon/retail channels |
| Refill pouch model | Up to 40% volume cut | Repeat-purchase brands |
One compliance note from our side: because our color-flame products are made from eco-friendly materials with no harmful chemicals, and ship with SGS/Intertek test reports, buyers avoid the specialized-carrier surcharges that plague poorly documented fire products. Clean documentation is itself a logistics saving. Do not forget les coûts de possession des stocks either — denser packaging means less warehouse space per unit, which quietly improves your TCO year after year.
Quel est un délai de retour sur investissement réaliste avant que je m'engage sur un nouveau moule auprès de mon fabricant ?
Seventeen years of OEM projects have taught our team one lesson above all: the buyers who set a payback ceiling before ordering tooling almost never regret the investment afterward.
Un délai de retour sur investissement réaliste pour les moules d'emballage de poudre Magic Fire est de 6 à 18 mois pour les marques établies avec un volume constant, et de 18 à 36 mois pour les lancements de nouveaux produits. Si les projections montrent un retour sur investissement au-delà de trois ans, retarde l'investissement ou commence plutôt avec des outils de transition moins chers.
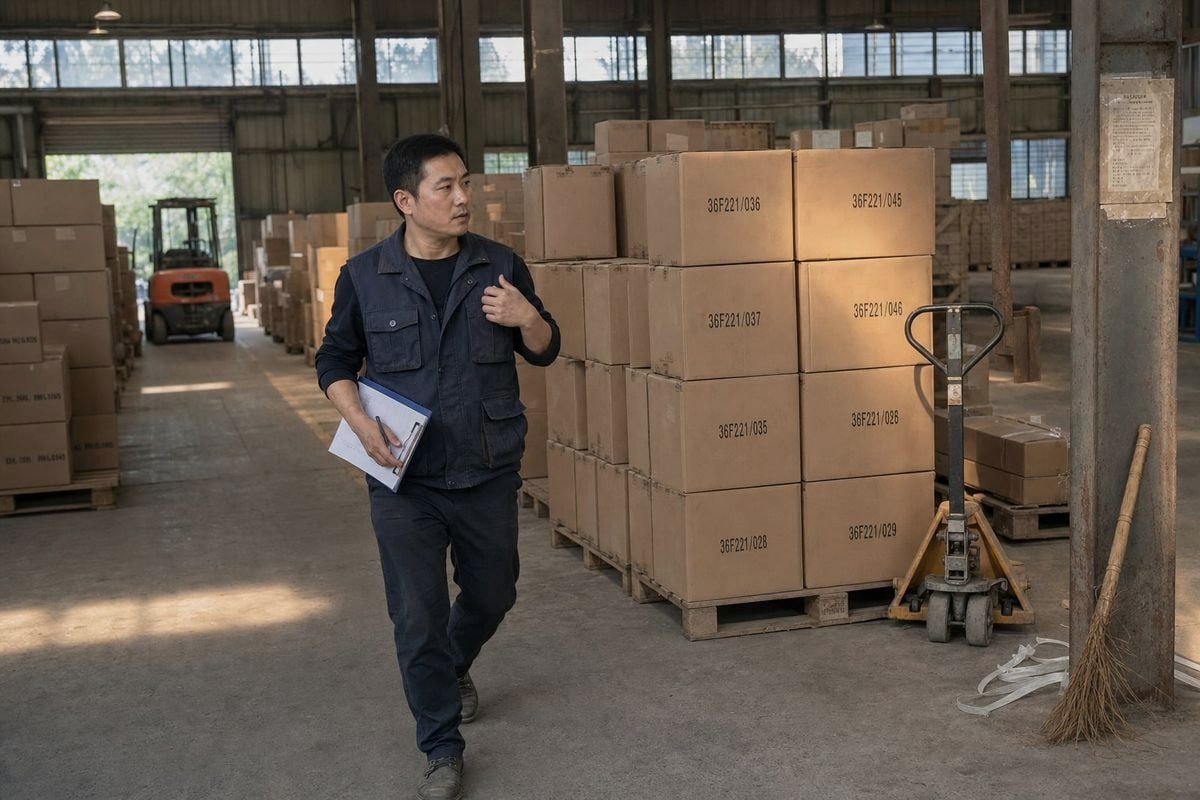
Timelines matter because tooling money is committed capital. Every dollar in a mold is a dollar unavailable for inventory, marketing, or other efficiency projects. That is why opportunity cost 6 belongs in this decision. Before approving tooling, compare its internal rate of return 7 against your next-best use of the same capital. A mold paying back in nine months usually beats most alternatives; one paying back in four years usually does not.
A decision framework we walk buyers through
- Forecast conservatively. Use your worst credible annual volume, not your target.
- Run three scenarios. Calculate payback at low, expected, and high volume.
- Add lifecycle costs. Include mold cleaning, storage, and potential cavity repairs in the investment figure. Skipping these is the most common way buyers underestimate true time-to-payback.
- Set a ceiling. Most of our long-term partners use 18–24 months as their maximum acceptable payback.
- Choose the tooling tier that fits. Uncertain demand points to bridge tooling; proven demand justifies production-grade steel.
When to say no — and the counterargument
Let me raise the objection skeptical buyers put to me directly: what if demand is seasonal or the design changes before the mold recoups its cost? It is a fair concern. Color-flame products do peak around camping season and winter holidays. Our answer is the hybrid path — start with the cheapest workable mold, validate real sell-through for one or two seasons, then commit to production tooling with actual data. That converts a speculative CapEx bet into a staged, evidence-based unit cost reduction plan.
The pro-investment case remains strong when volume is stable: mold ownership steadily compresses per-order costs and improves margin. The skeptical case wins when volume is thin or volatile. The framework above tells you which camp you are in — before the deposit leaves your account.
Conclusion
Mold payback is not about the sticker price. Compare Magic Fire Powder tooling cost against real delivery savings, run three volume scenarios, cap your timeline — then commit with confidence.
Notes de bas de page
1. NIST guidance on aligning production planning with manufacturing strategy and volume requirements. ↩︎
2. Highly stable and authoritative overview of tooling costs and engineering. ↩︎
3. Comprehensive overview of TCO as a financial estimate for determining direct and indirect costs. ↩︎
4. Official carrier guidelines on how package volume influences shipping rates via dimensional weight calculations. ↩︎
5. Industry leader's explanation of optimizing supply chains to reduce costs and improve delivery performance. ↩︎
6. Economic concept explaining the value of the next-best alternative foregone when making a decision. ↩︎
7. Standard authoritative financial definition for investment analysis. ↩︎



 English
  Spanish
  German
  French
  Arabic
  Portuguese
Rejoignez la conversation