







Safe stock levels for wood fire starters decide whether your FBA listing thrives or dies flammability review 1. I have watched buyers on our production line lose entire Q4 seasons to one miscalculation.
To calculate safe stock levels for wood fire starters on FBA, multiply average daily sales by total lead time, then add safety stock: Z-score × demand standard deviation × square root of lead time. Reorder when inventory hits lead time demand plus that buffer.
That formula sounds simple. But the inputs are where sellers go wrong. Let me walk you through each piece, using real numbers from fire starter orders we ship every week.
What formula should I use to calculate safe stock levels for wood fire starters sold on FBA?
One of our long-term US distributors once asked me why his "four weeks of cover" rule kept failing every November. The answer was in his math, not his supplier.
Use the reorder point formula: Reorder Point = (Average Daily Sales × Total Lead Time) + Safety Stock, where Safety Stock = Z × σ × √L. For a 95% service level, Z equals 1.65; for top sellers, use 97–99% to protect rankings.

There are three main safety stock calculation methods, and each fits a different situation. Here is how they compare:
| Método | Fórmula | Exposição de Caixa Inicial |
|---|---|---|
| Basic Z-score | Z × σ × √L | Stable demand, predictable lead times |
| Combined variability | Z × √(L × σ_D² + D̄² × σ_LT²) | Both sales and shipping vary a lot |
| Max/average heuristic | (Max Daily Sales × Max Lead Time) − (Avg Daily Sales × Avg Lead Time) | New sellers with limited data |
A worked example with real numbers
Suppose your fire starters sell 8 units per day on average. Your total lead time is 21 days. Your daily demand desvio padrão 2 is 3 units. You target a 95% service level, so Z is 1.65.
Lead time demand equals 8 × 21, which is 168 units. Safety stock equals 1.65 × 3 × √21, which is roughly 23 units. Your reorder point is 168 + 23, or 191 units. When FBA inventory drops to 191, you place your next order.
Which inputs matter most?
In my experience helping FBA brands plan orders from our Ningbo facility, sellers consistently underestimate lead time and overestimate demand stability. Measure demand daily, not monthly. Monthly averages hide PPC bursts and weekend spikes. Export 60–90 days of sales history and exclude any stockout days, or your average will be artificially low. Also track actual lead times from past shipments, not the transit time your freight forwarder promised. The gap between promised and actual is where stockout risk hides.
How much safety stock do I need to cover lead time delays from my China supplier?
Every January, our booking calendar in Ningbo fills up fast before Ano Novo Chinês 3. Buyers who planned for that gap sail through. Buyers who did not learn an expensive lesson.
Cover lead time delays by adding lead time variability to your formula: Safety Stock = Z × √(L × σ_D² + D̄² × σ_LT²). If your 30-day lead time varies by ±7 days, your buffer must absorb both demand swings and that shipping uncertainty.

Total lead time is not just ocean transit. It is every step from your purchase order to units being sellable in Amazon's system. From our side of the supply chain, here is what a realistic timeline looks like for wood fire starters shipped from China:
| Etapa | Duração Típica | Common Delay Causes |
|---|---|---|
| Produção | 15–25 dias | MOQ batching, wax-dipping cure time, peak season queues |
| Export prep & booking | 3–7 dias | Compliance docs, container availability |
| Trânsito marítimo | 18–35 days | Port congestion, weather, carrier rollovers |
| Customs & drayage | 2–7 dias | Inspections, chassis shortages |
| FBA check-in & FC transfer | 7–14 dias | Receiving backlogs, split shipments |
Add those up and your true lead time can run 45–85 days. Many sellers only count the ocean leg. That is why they run out.
Why lead time variability matters more than the average
If your lead time averages 60 days but ranges from 50 to 85, the standard deviation of lead time (σ_LT) is large. In the combined formula, that term often dominates. A supplier who is slower but consistent is safer than a fast supplier who is erratic. At our factory, we track dispatch dates against confirmed dates for exactly this reason. Our buyers use that history to set σ_LT with real data instead of guesses.
Don't forget Amazon's receiving delay
Amazon's FC transfer and check-in windows routinely add 7–14 days beyond carrier delivery. Treat that as part of lead time demand, not as slack. During Q4, check-in delays stretch even longer, so pad this stage in your seasonal calculations.
How do seasonal demand spikes affect my reorder point for wood fire starter inventory?
Our export volumes to the US and Germany tell a clear story every year: fire starter orders surge in late summer as brands prepare for the heating season. Demand for the end product follows a few months later.
Seasonal spikes can triple your average daily sales, so multiply your baseline demand by a seasonality index before calculating your reorder point. Use year-over-year data, not 30-day rolling averages, and raise service levels to 97–99% ahead of Q4 heating and Q3 camping peaks.

Wood fire starters are one of the most seasonal SKUs in the outdoor category. Fireplace and wood stove use drives a Q4 spike. Camping and grilling drive a summer shoulder peak. A flat reorder point ignores both.
Build a simple seasonality index
previsão de demanda sazonal does not need fancy software. Take last year's monthly sales. Divide each month by the annual monthly average. That ratio is your index. Here is a typical pattern we see reflected in our own production scheduling:
| Período | Typical Demand Index | Reorder Point Adjustment |
|---|---|---|
| Jan–Fev | 1.2× | Moderate buffer, post-holiday heating |
| Mar–Mai | 0.5× | Lean stock, avoid aged inventory fees |
| Jun–Ago | 0.9× | Camping season, watch weather trends |
| Set–Out | 1.4× | Build inventory ahead of the spike |
| Nov–Dez | 2.0–3.0× | Maximum buffer, highest service level |
Multiply your average daily sales by the index for the upcoming lead time window. If baseline is 8 units per day and October's index is 1.4, plan for 11–12 units per day when calculating lead time demand.
Watch the leading indicators
Long-range weather forecasts correlate with fire starter demand. A cold La Niña 4 winter forecast should push your buffers up. Also model PPC campaigns and lightning deals separately. A one-day deal spike is not organic demand growth, and if you feed it into your standard deviation blindly, you will overstock in the slow season. The key is recalculating your reorder point formula monthly, not setting it once a year. Because our production peaks in late summer, buyers who lock Q4 volumes with us by July consistently avoid the autumn scramble.
What MOQ and reorder cycle should I negotiate with my manufacturer to avoid FBA stockouts?
A purchasing manager from a US fireplace distributor recently asked us to split his annual volume into four staggered shipments instead of one big container. His storage fees dropped, and he never went out of stock. That conversation changed how I advise new buyers.
Negotiate an MOQ that covers 60–90 days of forecasted sales, with a reorder cycle timed so orders trigger at your reorder point. Prioritize staggered shipments, blanket orders with scheduled releases, and flexible trial MOQs over the lowest per-unit price.
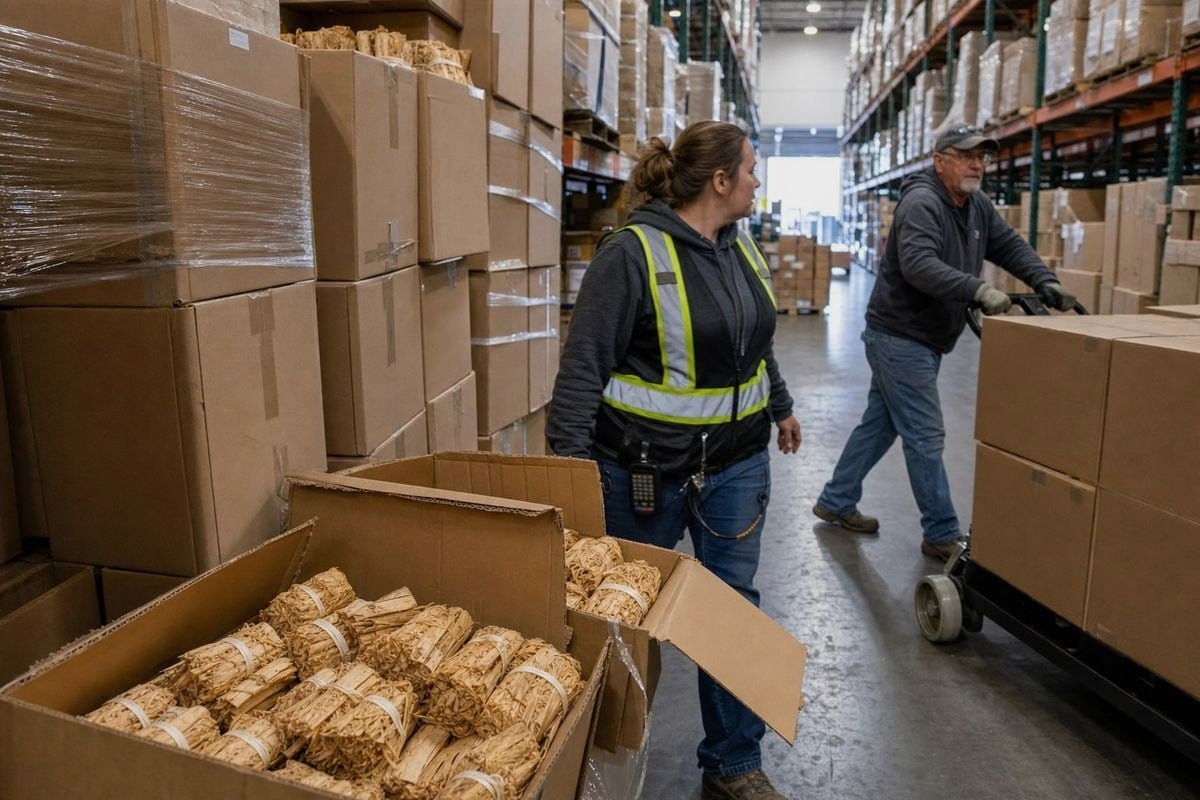
MOQ and reorder cycle are two sides of the same decision. Order too much per cycle, and Amazon storage fees and aged inventory risk eat your margin. Order too little, and you pay more per unit, ship more often, and may trigger Amazon's Low Inventory Level Fee if you hold under 28 days of historical supply. Your goal is a reorder cycle that keeps Days of Inventory in a healthy 45–75 day band.
Balance EOQ against FBA realities
O Economic Order Quantity 5 model balances ordering costs against holding costs. For fire starters, holding costs are higher than sellers expect. Wax and wood fiber products can face Hazmat storage requirements 6 or flammability review, which means stricter storage volume caps at Amazon. Many of our OEM clients use a drip-feed strategy: hold bulk reserves at a 3PL and send only 30 days of supply to FBA at a time. This protects your Inventory Performance Index while keeping deep stock available.
What to negotiate, in order of impact
- Staggered delivery on a blanket order, so one PO covers a season but ships in monthly releases.
- A trial MOQ for new SKUs or multi-packs, so you can validate demand before committing.
- Locked production slots ahead of Q4, since factory capacity, not price, is the real Q4 constraint.
- Private-label and packaging finalized early, because label reprints and barcode changes add days to lead time.
- Component-level planning for bundles, so a shortage in one SKU does not cascade across your catalog.
From 17+ years of running OEM programs for outdoor and BBQ brands, I can tell you the buyers who negotiate schedule flexibility outperform those who negotiate only price. Consistent, certified, on-time production is what actually prevents stockouts.
Conclusão
Stockouts kill rankings, and overstock kills cash flow. The fix is a dynamic reorder policy: real daily demand, true lead times, seasonal indexing, and a supplier who ships on schedule.
Start with the reorder point formula, recalculate monthly, and pressure-test your lead time assumptions before every peak season. At our Sunrich facilities in Liuyang and Ningbo, we build production schedules around exactly these buyer calculations, backed by ISO 9001 7, BSCI, CE, and SGS/Intertek compliance. When your safety stock math and your manufacturer's reliability line up, wood fire starters become one of the most predictable, profitable seasonal SKUs you can run on FBA.
Notas de rodapé
1. CPSC oversees flammability standards for consumer products like wood fire starters. ↩︎
2. Explains the statistical concept used to calculate safety stock variability. ↩︎
3. Background on the holiday causing predictable factory shutdowns and booking surges. ↩︎
4. Stable NOAA National Ocean Service page explaining the climate patterns of El Niño and La Niña. ↩︎
5. Background on the inventory model referenced for balancing ordering and holding costs. ↩︎
6. Direct link to OSHA Standard 1910.106, which governs the storage and handling of flammable materials. ↩︎
7. Official standard for quality management systems referenced as a manufacturer certification. ↩︎



 English
  Spanish
  German
  French
  Arabic
  Portuguese
Participe da conversa