






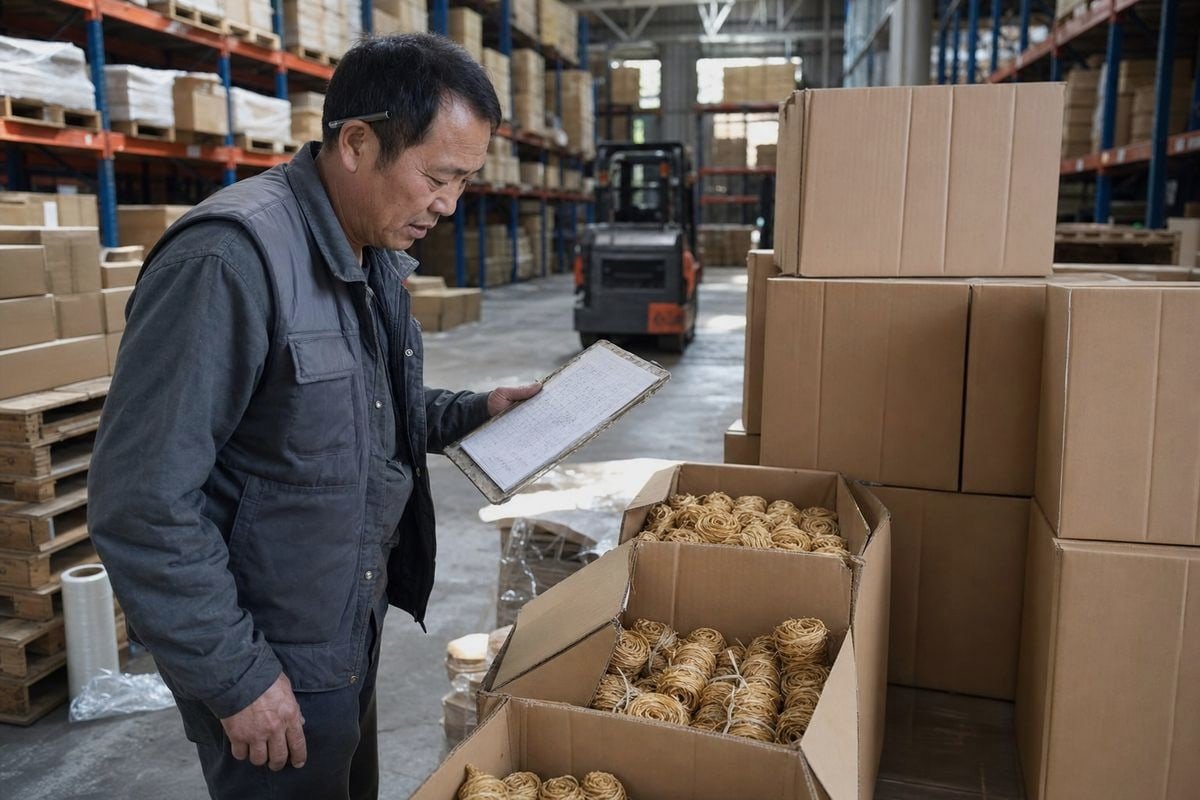
Niveles de stock seguros para iniciadores de fuego de leña deciden si tu listado FBA prospera o muere revisión de inflamabilidad 1. He visto a compradores en nuestra línea de producción perder temporadas completas de Q4 por un solo error de cálculo.
Para calcular los niveles de stock de seguridad para iniciadores de fuego de leña en FBA, multiplique las ventas diarias promedio por el tiempo de entrega total, luego agregue el stock de seguridad: puntuación Z × desviación estándar de la demanda × raíz cuadrada del tiempo de entrega. Vuelva a pedir cuando el inventario alcance la demanda del tiempo de entrega más ese colchón.
Esa fórmula suena simple. Pero los insumos son donde los vendedores se equivocan. Permítanme guiarlos a través de cada pieza, utilizando números reales de pedidos de iniciadores de fuego que enviamos cada semana.
¿Qué fórmula debería usar para calcular los niveles de stock seguros para iniciadores de fuego de madera vendidos en FBA?
Uno de nuestros distribuidores a largo plazo en EE. UU. me preguntó una vez por qué su regla de "cuatro semanas de cobertura" fallaba cada noviembre. La respuesta estaba en sus cálculos, no en su proveedor.
Utilice la fórmula del punto de reorden: Punto de Reorden = (Ventas Diarias Promedio × Tiempo Total de Entrega) + Stock de Seguridad, donde Stock de Seguridad = Z × σ × √L. Para un nivel de servicio del 95%, Z es igual a 1,65; para los más vendidos, utilice del 97% al 99% para proteger las clasificaciones.
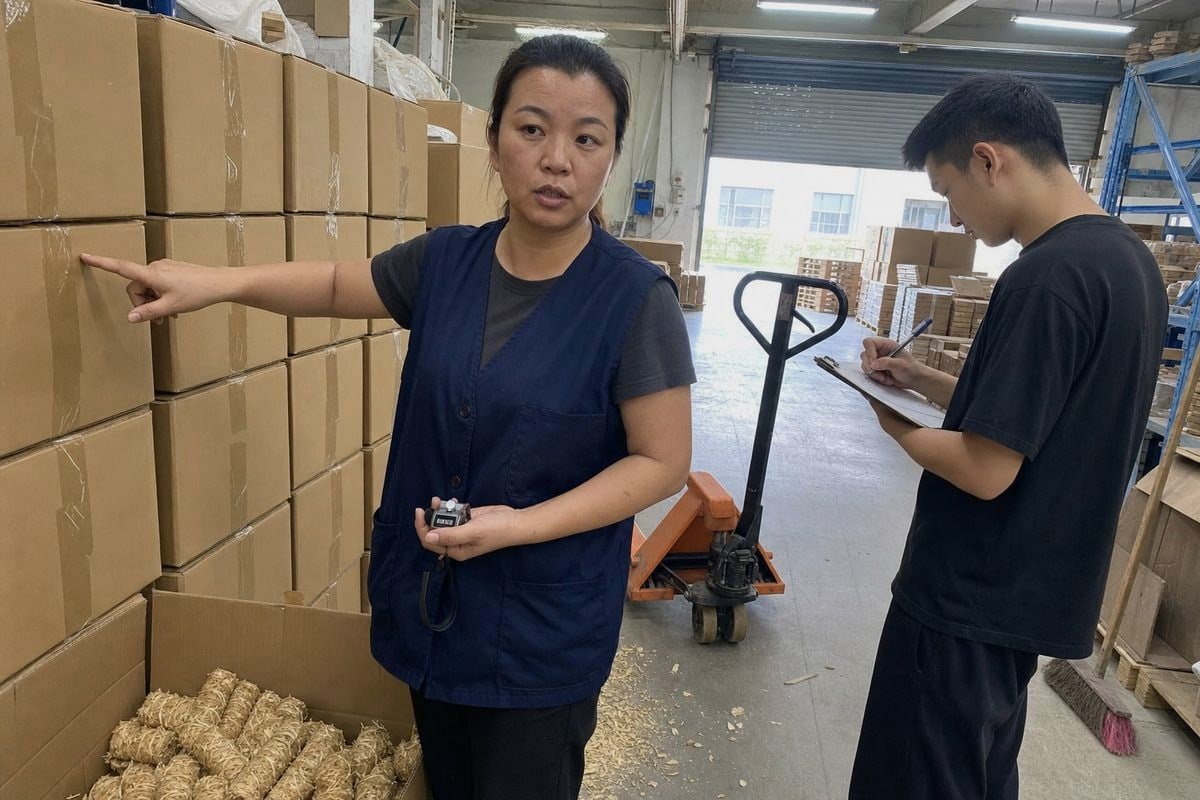
Existen tres métodos principales de cálculo de stock de seguridad, y cada uno se adapta a una situación diferente. Aquí se comparan:
| Método | Fórmula | Mejor para |
|---|---|---|
| Z-score básico | Z × σ × √L | Demanda estable, plazos de entrega predecibles |
| Variabilidad combinada | Z × √(L × σ_D² + D̄² × σ_LT²) | Tanto las ventas como los envíos varían mucho |
| Heurística Max/promedio | (Ventas Diarias Máximas × Plazo de Entrega Máximo) − (Ventas Diarias Promedio × Plazo de Entrega Promedio) | Nuevos vendedores con datos limitados |
Un ejemplo práctico con números reales
Supongamos que tus iniciadores de fuego venden 8 unidades por día en promedio. Tu plazo de entrega total es de 21 días. Tu demanda diaria desviación estándar 2 es de 3 unidades. Apuntas a un nivel de servicio del 95%, por lo que Z es 1.65.
La demanda del plazo de entrega es igual a 8 × 21, que son 168 unidades. El stock de seguridad es igual a 1.65 × 3 × √21, que son aproximadamente 23 unidades. Tu punto de reorden es 168 + 23, o 191 unidades. Cuando el inventario de FBA cae a 191, realizas tu próximo pedido.
¿Qué insumos importan más?
En mi experiencia ayudando a marcas de FBA a planificar pedidos desde nuestra planta de Ningbo, los vendedores subestiman consistentemente el plazo de entrega y sobreestiman la estabilidad de la demanda. Mide la demanda diariamente, no mensualmente. Los promedios mensuales ocultan los picos de PPC y los picos de fin de semana. Exporta 60–90 días de historial de ventas y excluye cualquier día de falta de stock, o tu promedio será artificialmente bajo. También rastrea los plazos de entrega reales de los envíos pasados, no el tiempo de tránsito que prometió tu transitario. La brecha entre lo prometido y lo real es donde se esconde el riesgo de falta de stock.
¿Cuánta reserva de seguridad necesito para cubrir los retrasos en el plazo de entrega de mi proveedor chino?
Cada enero, nuestro calendario de reservas en Ningbo se llena rápidamente antes Año Nuevo Chino 3. Los compradores que planificaron esa brecha navegan sin problemas. Los compradores que no lo hicieron aprendieron una lección costosa.
Cubra los retrasos en el tiempo de entrega añadiendo variabilidad al tiempo de entrega a su fórmula: Stock de seguridad = Z × √(L × σ_D² + D̄² × σ_LT²). Si su tiempo de entrega de 30 días varía en ±7 días, su colchón debe absorber tanto las fluctuaciones de la demanda como esa incertidumbre de envío.

El plazo de entrega total no es solo el tránsito marítimo. Es cada paso desde tu orden de compra hasta que las unidades sean vendibles en el sistema de Amazon. Desde nuestro lado de la cadena de suministro, así es como se ve un cronograma realista para iniciadores de fuego de leña enviados desde China:
| Etapa | Duración típica | Causas comunes de retraso |
|---|---|---|
| Producción | 15–25 días | Agrupación de MOQ, tiempo de curado de inmersión en cera, colas de temporada alta |
| Preparación de exportación y reserva | 3–7 días | Documentos de cumplimiento, disponibilidad de contenedores |
| Tránsito marítimo | 18–35 días | Congestión portuaria, clima, cancelaciones de transportistas |
| Aduanas y transporte terrestre | 2–7 días | Inspecciones, escasez de chasis |
| Verificación y transferencia de FC de FBA | 7–14 días | Retrasos en la recepción, envíos divididos |
Suma todo eso y tu plazo de entrega real puede ser de 45 a 85 días. Muchos vendedores solo cuentan la etapa marítima. Por eso se quedan sin stock.
Por qué la variabilidad del plazo de entrega importa más que el promedio
Si tu plazo de entrega promedia 60 días pero varía entre 50 y 85, la desviación estándar del plazo de entrega (σ_LT) es grande. En la fórmula combinada, ese término a menudo domina. Un proveedor más lento pero consistente es más seguro que un proveedor rápido pero errático. En nuestra fábrica, rastreamos las fechas de envío frente a las fechas confirmadas por exactamente esta razón. Nuestros compradores utilizan ese historial para establecer σ_LT con datos reales en lugar de suposiciones.
No olvides el retraso en la recepción de Amazon
Las ventanas de transferencia y verificación de FC de Amazon rutinariamente agregan 7–14 días más allá de la entrega del transportista. Trata eso como parte de la demanda del plazo de entrega, no como margen. Durante Q4, los retrasos en la verificación se extienden aún más, así que agrega esta etapa en tus cálculos de temporada.
¿Cómo afectan los picos de demanda estacional a mi punto de reorden de inventario de iniciadores de fuego de leña?
Nuestros volúmenes de exportación a EE. UU. y Alemania cuentan una historia clara cada año: los pedidos de iniciadores de fuego aumentan a finales del verano a medida que las marcas se preparan para la temporada de calefacción. La demanda del producto final llega unos meses después.
Los picos estacionales pueden triplicar tus ventas diarias promedio, así que multiplica tu demanda base por un índice de estacionalidad antes de calcular tu punto de reorden. Utiliza datos interanuales, no promedios móviles de 30 días, y eleva los niveles de servicio al 97–99% antes de los picos de calefacción del cuarto trimestre y de acampada del tercer trimestre.

Los iniciadores de fuego de leña son uno de los SKU más estacionales en la categoría exterior. El uso de chimeneas y estufas de leña impulsa un pico en el cuarto trimestre. El campamento y la parrilla impulsan un pico intermedio en verano. Un punto de reorden fijo ignora ambos.
Construye un índice de estacionalidad simple
Previsión de la demanda estacional no necesita software sofisticado. Tome las ventas mensuales del año pasado. Divida cada mes por el promedio mensual anual. Esa relación es su índice. Aquí hay un patrón típico que vemos reflejado en nuestra propia programación de producción:
| Período | Índice de Demanda Típico | Ajuste del Punto de Reorden |
|---|---|---|
| Ene-Feb | 1.2× | Buffer moderado, calefacción post-vacaciones |
| Mar-May | 0.5× | Stock magro, evite tarifas de inventario obsoleto |
| Jun-Ago | 0.9× | Temporada de campamento, observe las tendencias climáticas |
| Sep-Oct | 1.4× | Acumule inventario antes del pico |
| Nov-Dic | 2.0–3.0× | Buffer máximo, nivel de servicio más alto |
Multiplique sus ventas diarias promedio por el índice para la ventana de tiempo de entrega próxima. Si la base es de 8 unidades por día y el índice de octubre es 1.4, planifique 11-12 unidades por día al calcular la demanda de tiempo de entrega.
Observe los indicadores principales
Los pronósticos meteorológicos a largo plazo se correlacionan con la demanda de iniciadores de fuego. Un pronóstico de invierno La Niña 4 debería aumentar sus buffers. Modele también las campañas de PPC y las ofertas relámpago por separado. Un pico de oferta de un día no es un crecimiento orgánico de la demanda, y si lo introduce en su desviación estándar a ciegas, se sobreabastecerá en la temporada baja. La clave es recalcular su fórmula de punto de reorden mensualmente, no establecerla una vez al año. Debido a que nuestra producción alcanza su punto máximo a finales del verano, los compradores que bloquean los volúmenes del cuarto trimestre con nosotros en julio evitan consistentemente la carrera de otoño.
¿Qué MOQ y ciclo de reordenamiento debo negociar con mi fabricante para evitar roturas de stock de FBA?
Un gerente de compras de un distribuidor de chimeneas de EE. UU. nos pidió recientemente que dividiéramos su volumen anual en cuatro envíos escalonados en lugar de un solo contenedor grande. Sus tarifas de almacenamiento disminuyeron y nunca se quedó sin stock. Esa conversación cambió la forma en que asesoro a los nuevos compradores.
Negocia una MOQ que cubra 60–90 días de ventas pronosticadas, con un ciclo de reposición programado para que los pedidos se activen en tu punto de reposición. Prioriza envíos escalonados, pedidos globales con entregas programadas y MOQs de prueba flexibles sobre el precio unitario más bajo.
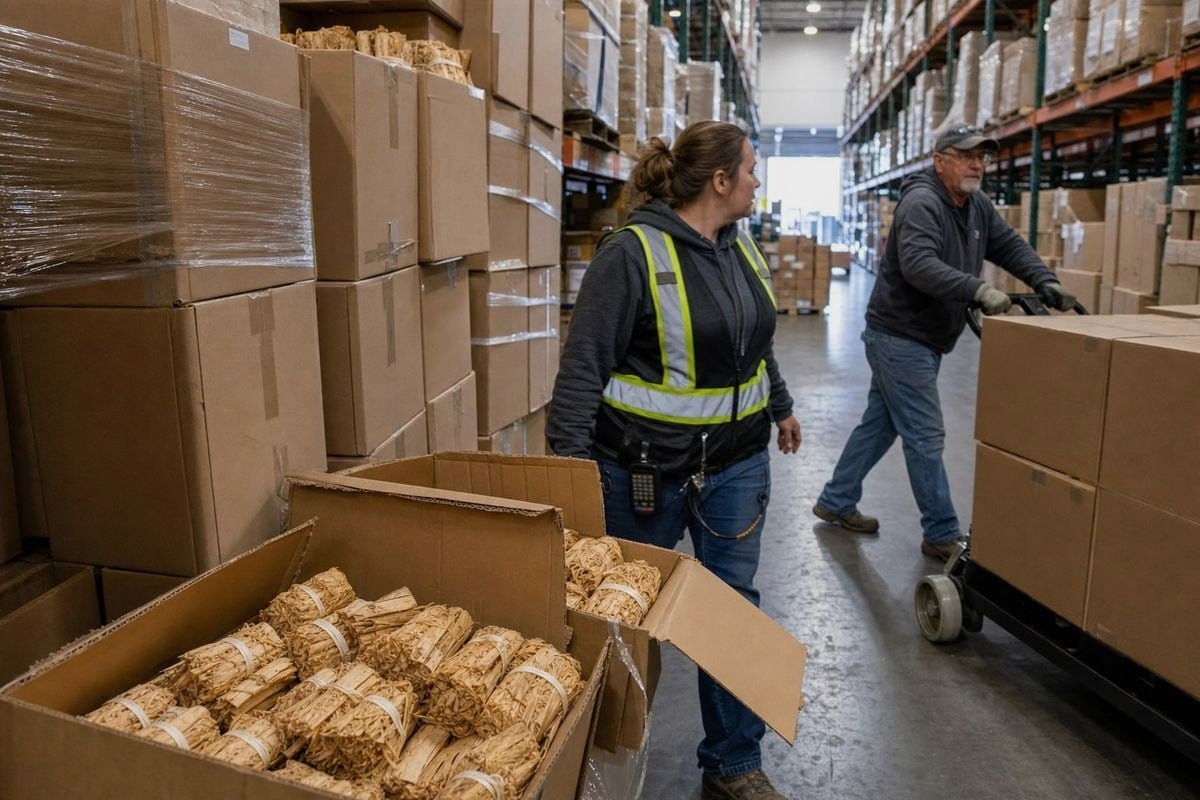
MOQ y ciclo de reorden son dos caras de la misma decisión. Ordene demasiado por ciclo, y las tarifas de almacenamiento de Amazon y el riesgo de inventario obsoleto se comen su margen. Ordene muy poco, y paga más por unidad, envía con más frecuencia y puede activar la Tarifa por Nivel Bajo de Inventario de Amazon si mantiene menos de 28 días de suministro histórico. Su objetivo es un ciclo de reorden que mantenga los Días de Inventario en una banda saludable de 45-75 días.
Equilibre el EOQ frente a las realidades de FBA
La Cantidad Económica de Pedido 5 modelo equilibra los costos de pedido con los costos de mantenimiento. Para los iniciadores de fuego, los costos de mantenimiento son más altos de lo que esperan los vendedores. Los productos de cera y fibra de madera pueden enfrentar requisitos de almacenamiento de materiales peligrosos 6 o revisión de inflamabilidad, lo que significa límites de volumen de almacenamiento más estrictos en Amazon. Muchos de nuestros clientes OEM utilizan una estrategia de alimentación por goteo: mantienen reservas a granel en un 3PL y envían solo 30 días de suministro a FBA a la vez. Esto protege su Índice de Rendimiento de Inventario mientras mantiene disponible un stock profundo.
Qué negociar, en orden de impacto
- Entrega escalonada en un pedido general, de modo que una orden de compra cubra una temporada pero se envíe en lanzamientos mensuales.
- Un MOQ de prueba para SKU nuevos o multipacks, para que pueda validar la demanda antes de comprometerse.
- Bloqueo de ranuras de producción antes del cuarto trimestre, ya que la capacidad de la fábrica, no el precio, es la verdadera restricción del cuarto trimestre.
- Etiquetado privado y empaque finalizados temprano, ya que las reimpresiones de etiquetas y los cambios de códigos de barras agregan días al tiempo de entrega.
- Planificación a nivel de componente para paquetes, de modo que la escasez en un SKU no se extienda por todo su catálogo.
De los más de 17 años de ejecución de programas OEM para marcas de exteriores y barbacoas, puedo decirles que los compradores que negocian flexibilidad de programación superan a los que solo negocian precios. La producción constante, certificada y a tiempo es lo que realmente previene las roturas de stock.
Conclusión
Las roturas de stock matan los rankings y el exceso de stock mata el flujo de caja. La solución es una política de reorden dinámica: demanda diaria real, tiempos de entrega verdaderos, indexación estacional y un proveedor que envía a tiempo.
Comience con la fórmula del punto de reorden, recalcule mensualmente y ponga a prueba sus suposiciones de tiempo de entrega antes de cada temporada alta. En nuestras instalaciones de Sunrich en Liuyang y Ningbo, construimos los cronogramas de producción en torno a exactamente estos cálculos de compradores, respaldados por ISO 9001 7, cumplimiento de BSCI, CE y SGS/Intertek. Cuando las matemáticas de su stock de seguridad y la confiabilidad de su fabricante se alinean, los iniciadores de fuego de leña se convierten en uno de los SKU estacionales más predecibles y rentables que puede ejecutar en FBA.
Notas al pie
La CPSC supervisa los estándares de inflamabilidad para productos de consumo como los iniciadores de fuego de leña. ↩︎
Explica el concepto estadístico utilizado para calcular la variabilidad del stock de seguridad. ↩︎
Antecedentes sobre el feriado que causa cierres de fábrica predecibles y aumentos de reservas. ↩︎
Página estable del Servicio Nacional Oceánico de la NOAA que explica los patrones climáticos de El Niño y La Niña. ↩︎
Antecedentes sobre el modelo de inventario al que se hace referencia para equilibrar los costos de pedido y mantenimiento. ↩︎
Enlace directo a la Norma OSHA 1910.106, que rige el almacenamiento y manejo de materiales inflamables. ↩︎
Norma oficial para sistemas de gestión de calidad referenciada como certificación de fabricante. ↩︎



 English
  Spanish
  German
  French
  Arabic
  Portuguese
Únete a la conversación