







Balancing cost, inventory, and stockout risk for colored pine cones is a real puzzle Rapports de test SGS/Intertek 1. On our production line, we watch buyers wrestle with it every single season.
To balance cost, inventory, and stockout risk for colored pine cones, order by SKU-level demand, hold safety stock only on core colors, set reorder points from supplier lead times, and use small trial orders before bulk commitments. This minimizes carrying cost while protecting peak-season availability.
That answer sounds simple. But each part hides a decision. Let me walk you through how we help importers get each one right.
What MOQ and Order Frequency Help Me Avoid Overstocking Colored Pine Cones?
One buyer from Germany once told me his warehouse still held two pallets of colored pine cones in March economic order quantity 2. He had ordered his full season volume in one shot. We now plan his orders differently.
A split-order approach works best: place 60–70% of forecast volume as a base order before peak season, then schedule one or two smaller replenishment orders. Choose a supplier whose MOQ allows per-color flexibility, so slow-moving colors never pile up in your warehouse.
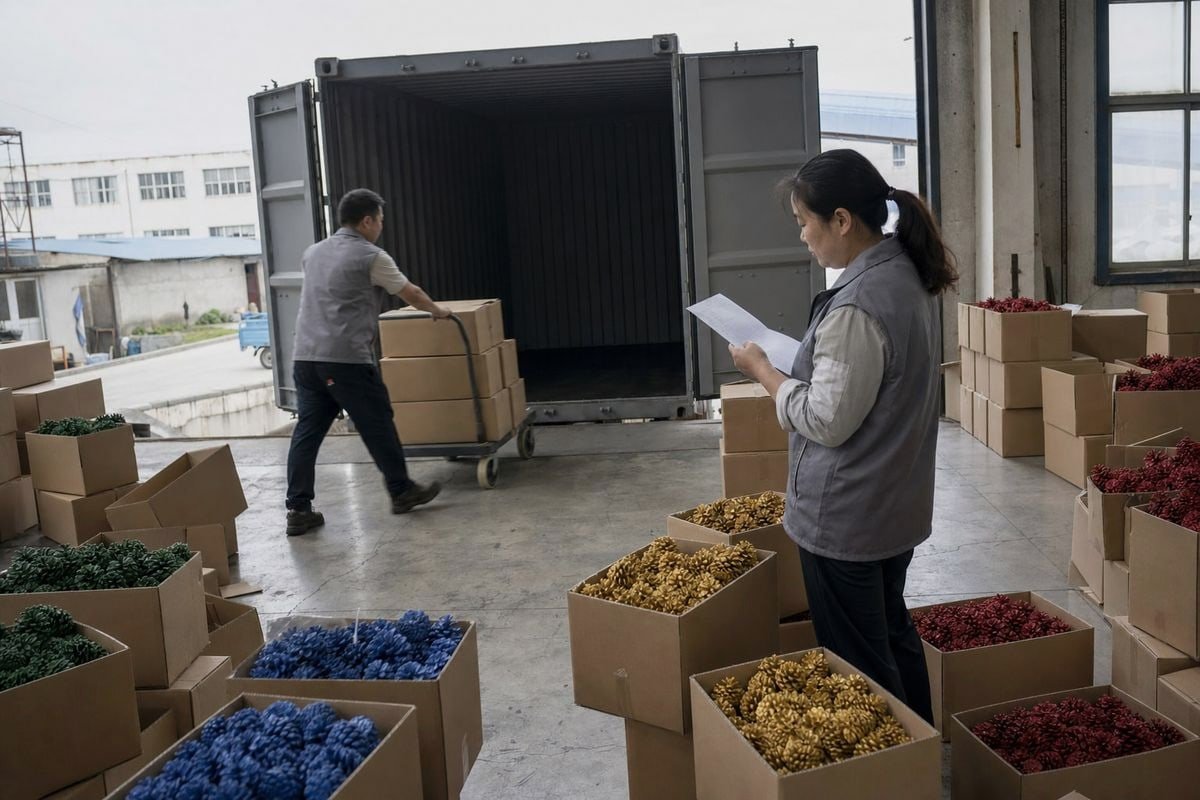
Overstocking rarely comes from ordering too much in total. It comes from ordering the wrong mix. Red, gold, and rainbow-flame packs move fast around holidays. Niche colors move slowly all year. If your MOQ forces you to buy every color in equal volume, you will overstock the slow ones. That is why we structure MOQs at our Ningbo facility to allow mixed-color containers. You hit the total MOQ, but you decide the color split.
Match Order Frequency to Demand Shape
Colored pine cone demand is not flat. It spikes hard in autumn and around the winter holidays, both for décor cones and for our color-flame fireplace cones. A single annual order forces you to guess the whole season in advance. Two or three staggered orders let you correct the mix using real sell-through data.
Here is a simple framework we recommend to our distributors:
| Order Strategy | Cash Tied Up | Risque de surstock | Stockout Risk | Idéal pour |
|---|---|---|---|---|
| One large annual order | Élevé | Élevé | Low early, high late | Very stable demand |
| Base order + 1–2 replenishments | Moyen | Faible | Faible | La plupart des acheteurs saisonniers |
| Frequent small orders | Faible | Très faible | High if lead times slip | Fast, reliable supply chains |
Why EOQ Still Matters
The classic EOQ formula 3 (EOQ = √(2DS/H)) balances ordering cost against holding cost. For seasonal cones, use it as a sanity check, not a rule. Your true constraint is the season window. Any stock left after the holidays carries into next year, and that carrying cost is what EOQ helps you see clearly.
How Can I Calculate the Right Safety Stock to Prevent Stockouts During Peak Season?
Every October, our factory floor in Ningbo runs at full pace on color-flame pine cones. The buyers who planned safety stock in July sleep well. The buyers who did not are the ones emailing us for rush air freight.
Calculate safety stock with the service-level method: safety stock = Z-score × demand standard deviation during lead time. For core holiday colors, target a 95–98% service level. For niche colors, accept 85–90% to avoid tying up cash in slow-moving inventory.
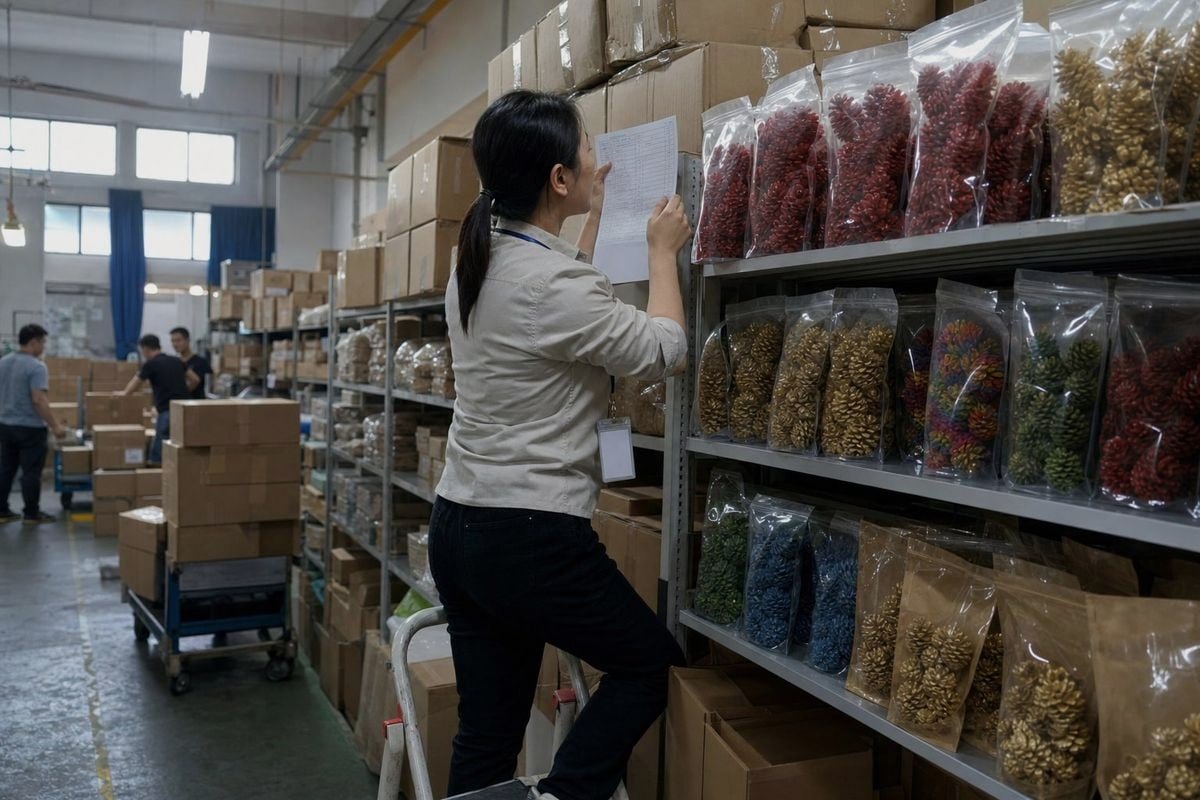
Safety stock is not a comfort blanket. It is a priced decision. More buffer lowers your stockout probability but raises holding cost and leftover risk. Less buffer frees cash but exposes you during demand spikes. The goal is not maximum coverage. The goal is the level that minimizes your total cost per SKU.
Two Practical Methods
If you have historical sales data, use the statistical method. Take your average weekly demand during peak season, measure how much it varies, and multiply that variability by a Z-score 4 tied to your target service level. A Z of 1.65 covers roughly 95% of demand scenarios.
If your data is thin, use the rule-of-thumb method instead. Compare maximum daily usage against average daily usage across your lead time:
Safety stock = (max daily sales × max lead time) − (average daily sales × average lead time)
Not All Colors Deserve the Same Buffer
This is where most buyers overspend. They apply one service level across the whole product family. In our experience exporting to 30+ countries, demand is heavily concentrated in a few core SKUs during the holiday window.
| Classe de SKU | Exemple | Target Service Level | Buffer Approach |
|---|---|---|---|
| A: Core holiday sellers | Rainbow-flame packs, red, gold | 95–98% | Full statistical safety stock |
| B: Steady movers | Green, blue décor cones | 90–95% | Moderate buffer |
| C: Niche variants | Specialty single colors | 85–90% | Minimal buffer, reorder on signal |
A stockout on a core color during the two-week holiday rush costs you far more than the extra units cost to hold. A stockout on a niche color mostly costs you nothing, because customers substitute within your range.
Which Supplier Lead Times Should I Plan Around to Keep My Inventory Costs Down?
A lesson we learned years ago: a late shipment in November is not a delay, it is a lost season. That is why we publish honest production timelines instead of optimistic ones, and why our batch-to-batch QC exists to prevent rework delays.
Plan around total lead time, not just production time: 15–30 days for manufacturing, 30–40 days for sea freight to the US or Europe, plus customs and inland transit. Build your reorder point as lead-time demand plus safety stock, and confirm peak-season slots by midsummer.

Lead time drives your entire inventory math. The longer and less predictable it is, the more safety stock you need, and the higher your carrying cost becomes. Shorten or stabilize lead time, and your inventory cost drops without raising stockout risk. That is the cheapest inventory improvement available to most importers.
Break Down the Full Timeline
Buyers often plan around the factory quote alone. That is a mistake. Map every stage:
| Étape | Durée typique | Variability Risk |
|---|---|---|
| Production (standard SKUs) | 15–25 jours | Low with a real factory |
| Production (custom OEM packaging) | 25–35 jours | Medium, add artwork approval time |
| Sea freight to US/EU | 30–40 jours | Medium to high in Q4 |
| Customs and compliance checks | 3–10 jours | Low with full certification |
| Livraison intérieure à l'entrepôt | 3–7 jours | Faible |
Two points deserve attention. First, Q4 freight is the least reliable stage. Book early and pad your reorder point during peak months. Second, customs is where uncertified goods die. Our Marquage CE 5 and SGS/Intertek test reports exist precisely so our buyers' containers do not sit in inspection. A compliance delay of two weeks in November can wipe out an entire retail program.
The Reorder Point Formula
Reorder point = (average daily demand × total lead time in days) + safety stock
If you sell 40 packs per day in season, and your true door-to-door lead time is 55 days, your lead-time demand is 2,200 packs. Add your safety stock on top. When inventory touches that number, you order. Not before, not after. Automate the alert in your inventory software so nobody has to remember.
Reduce Variability Before Adding Stock
Vet suppliers on consistency, not just price. A factory whose first sample reliably matches mass production, and whose delivery dates hold, lets you carry a smaller buffer permanently. That saving compounds every season.
Can Flexible Trial Orders Help Me Test Demand Before Committing to Bulk Pricing?
When a UK camping brand first approached us, they were unsure whether color-flame pine cones would sell alongside their firestarter range. We shipped a small trial batch with their private-label pouch. Three months later, they placed a full container order with confidence.
Yes. A flexible trial order lets you validate real sell-through by color, pack format, and channel before committing capital to bulk pricing. Test one season window, measure weekly sales per SKU, then scale the winners and drop the laggards in your bulk order.
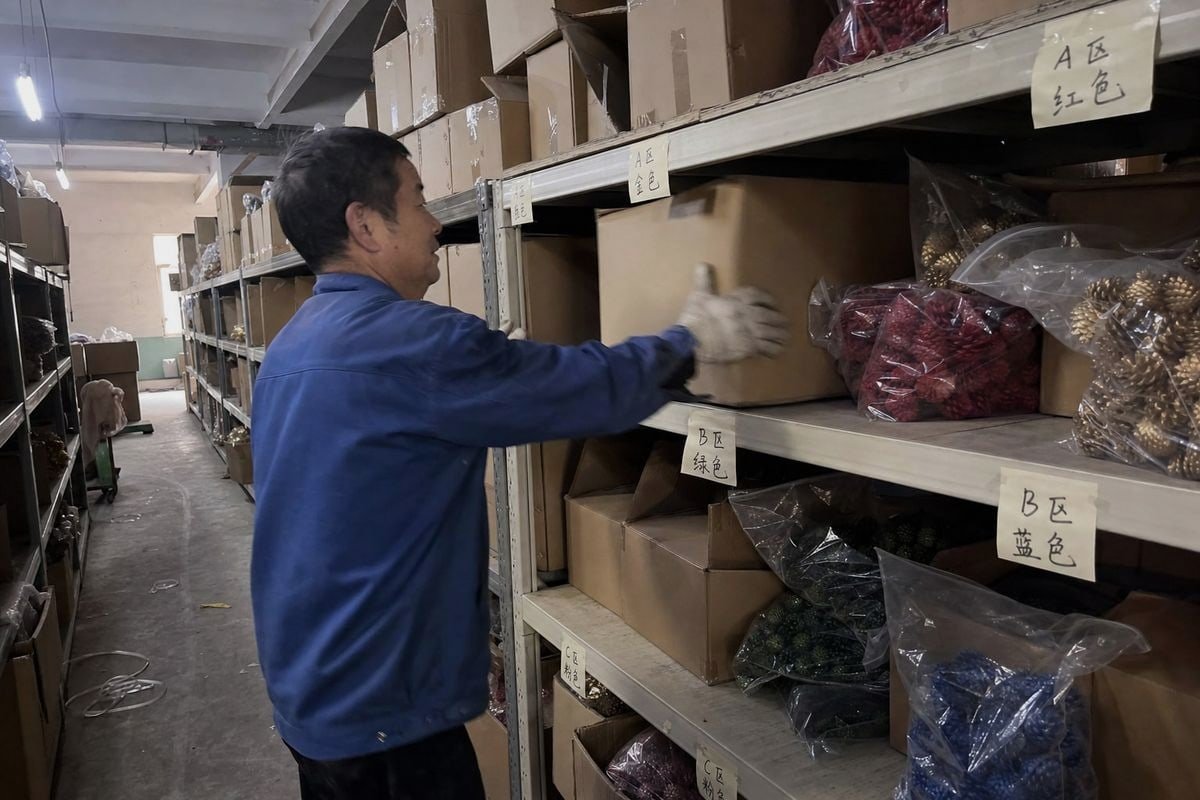
Trial orders are the cheapest form of demand forecasting. No spreadsheet model beats actual shelf data. For a niche, color-specific product like colored pine cones, this matters even more, because your real risk is not total volume. It is mix risk. A trial tells you whether your market prefers décor cones or fire-coloring cones, kraft pouches or jars, single colors or rainbow assortments.
Run the Trial Like an Experiment
Do not just order a small batch and hope. Structure it:
- Pick two or three formats. For example, a resealable kraft pouch for camping retail and a burlap gift sack for fireplace and holiday channels.
- Spread the trial across your strongest sales channels. Online, one retail partner, one seasonal event.
- Track weekly sell-through per SKU. Not monthly. Seasonal windows are short, and weekly data catches trends in time to act.
- Set decision thresholds in advance. Define what sell-through rate triggers a bulk order and what rate kills a SKU.
- Feed results into your bulk negotiation. You now know which colors and formats deserve volume pricing.
What to Demand From Your Supplier
A trial only works if your supplier supports it. Ask for a reduced trial MOQ 6, sample-to-production consistency, and private-label options 7 at trial scale. We built our OEM/ODM process around exactly this: custom packaging, warning labels, and barcodes are available even on smaller first orders, because we would rather earn a long-term partner than a single large speculative order. A buyer who tests properly reorders reliably. A buyer who overcommits blind often disappears after one bad season, and that helps nobody.
Trial Data Beats Trend Guessing
Décor color trends shift. Wedding palettes and seasonal shades move demand between colors year to year. Trial data from your own channel, this year, will always beat industry trend reports from last year. Use trends to choose what to test. Use trials to choose what to buy in bulk.
Conclusion
Balancing cost, inventory, and stockout risk for colored pine cones comes down to SKU-level planning: split orders, tiered safety stock, honest lead times, and trial-then-scale buying. Get those four right, and your season protects itself.
Notes de bas de page
1. SGS is a leading inspection and testing body cited for compliance documentation in trade. ↩︎
2. Provides background on the EOQ formula referenced for inventory cost sanity checks. ↩︎
3. Explains the classic inventory cost-balancing formula referenced as a sanity check for order sizing. ↩︎
4. Defines the statistical concept used to translate service levels into safety stock buffers. ↩︎



 English
  Spanish
  German
  French
  Arabic
  Portuguese
Rejoignez la conversation