






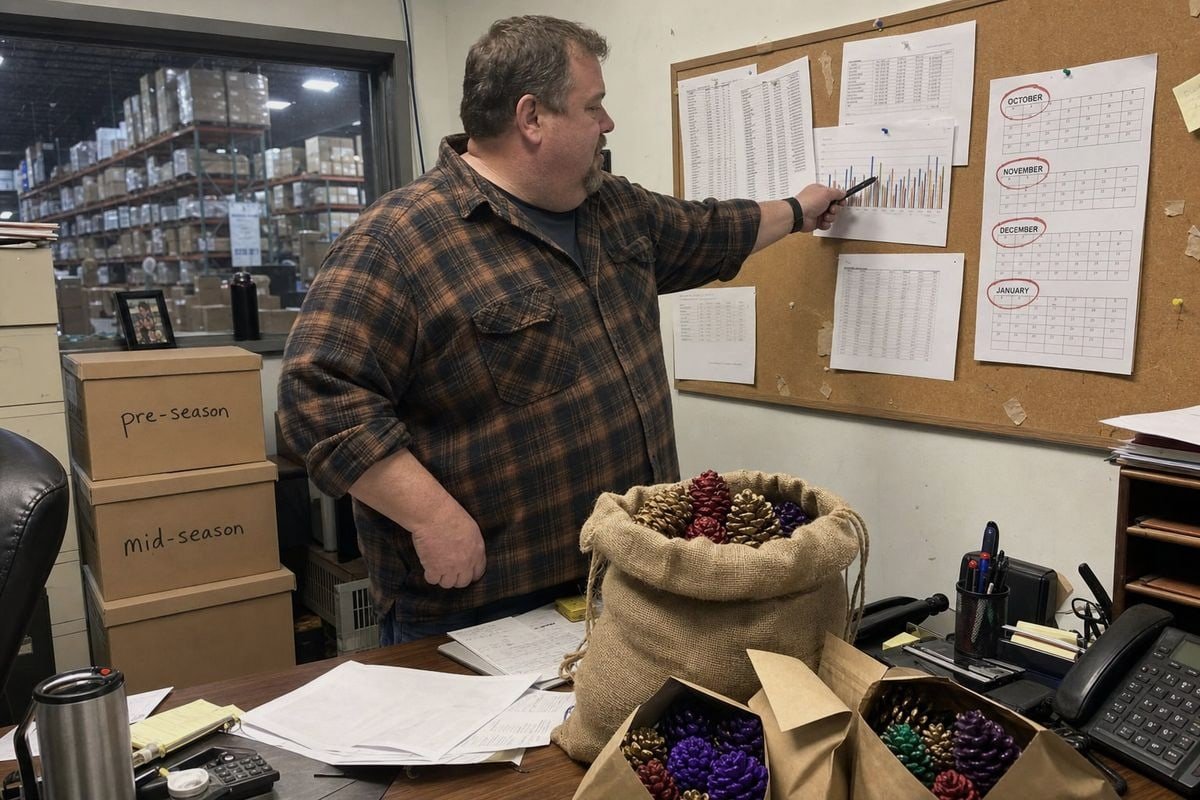
Die Prognose des jährlichen Nachkaufbedarfs für bemalte Kiefernzapfen für den Kamin ist schwierig. Unser Produktionsteam stellt jedes Jahr fest, dass Käufer falsch raten – und die Kosten für falsches Raten steigen weiter.
Um die jährliche Nachfrage nach Kamin-farbigen Kiefernzapfen vorherzusagen, kombinieren Sie die Verkaufsdaten der letzten Saison mit Anpassungen für Fehlbestände, saisonalen Indizes für das Fenster Oktober–Januar, erwartetem Distributionswachstum und Lieferzeiten der Lieferanten. Teilen Sie dann die Bestellung in Vor-Saison- und Mittel-Saison-Tranchen mit Sicherheitsbestandspuffern auf.
Das ist die kurze Antwort. Nun führe ich Sie durch jedes Detail und verwende dabei, was wir in unseren Exportmärkten jede Saison sehen.
Welche saisonalen Verkaufsmuster sollte ich verfolgen, um das Rückkaufvolumen für das nächste Jahr vorherzusagen?
Ein Händler in Polen erzählte mir einmal, dass sich sein Verkauf von bemalten Kiefernzapfen im November "flach" anfühlte. Unsere Versandaufzeichnungen zeigten, warum: Er war ausverkauft. Seine Daten verbargen die tatsächliche Nachfragekurve.
Wöchentliche Stückzahlen im Q4-Zeitfenster (Oktober–Januar) verfolgen, in dem sich etwa 80 % des Kamin-bezogenen Volumens konzentrieren. Erfassen Sie Ausverkaufsdaten, Aktionszeitpunkte, Auslöser für den ersten Frost und Kanalaufteilungen. Diese Muster – nicht die Jahresgesamtsummen – enthüllen das wahre Wiederholungskaufvolumen, das Sie für die nächste Saison benötigen.
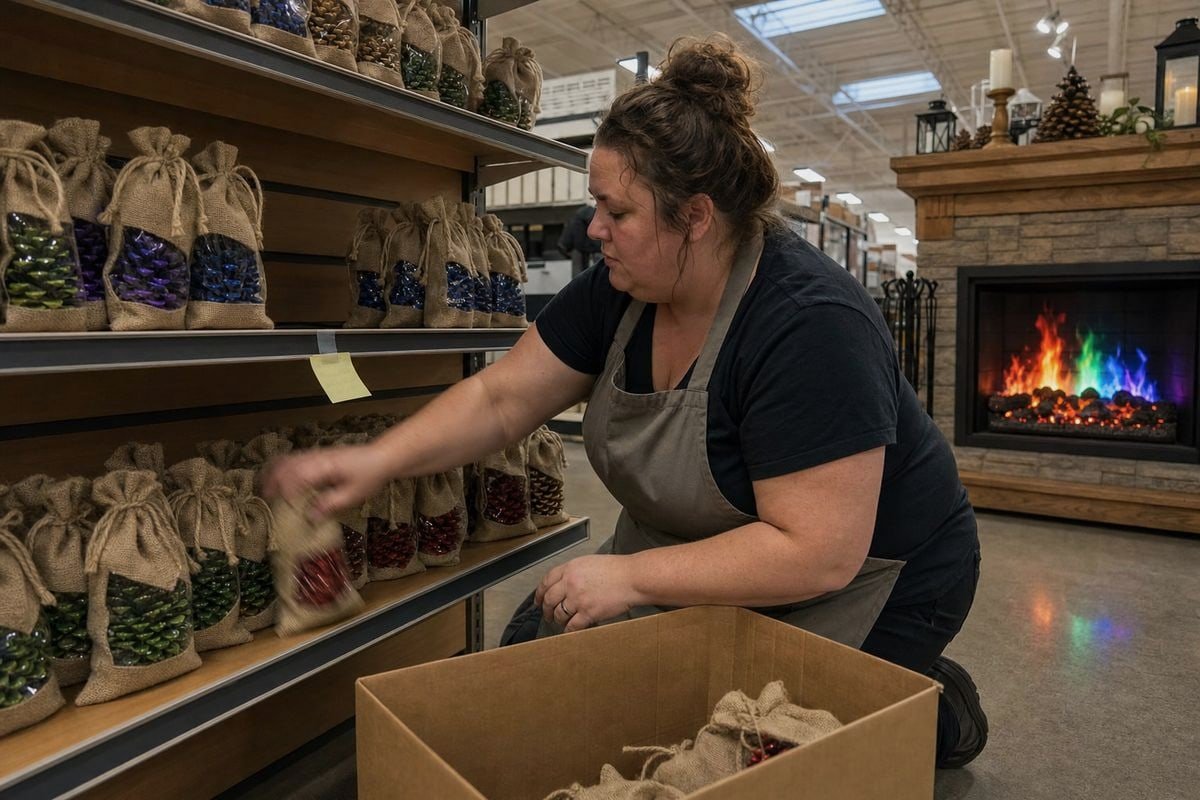
Bemalte Kiefernzapfen für den Kamin sind ein stark saisonales, selten gekauftes Dekorationsartikel. Jahresdurchschnitte werden Sie irreführen. Das Produkt verkauft sich in einem engen Zeitfenster, liegt den Rest des Jahres nahe Null und reagiert stark auf das Wetter. Die Muster, die Sie verfolgen, müssen also dieser Realität entsprechen.
Die vier wichtigsten Muster
Erstens, verfolgen Sie die wöchentlichen Stückverkäufe von September bis Februar. Monatsdaten sind oft zu grob. Ein Kälteeinbruch in Woche 44 kann mehr Säcke bewegen als der gesamte Oktober. Zweitens, protokollieren Sie jeden Tag des Ausverkaufs. Wenn Sie am 10. Dezember ausverkauft waren, unterschätzen Ihre Dezemberverkäufe die tatsächliche Nachfrage – manchmal erheblich. Drittens, beachten Sie den Zeitpunkt von Werbeaktionen und Auslagen. Eine Endkappen-Auslage in der Nähe des Gangs für Kamin- und Terrassenzubehör kann die wöchentliche Geschwindigkeit verdoppeln, und Sie müssen diesen Anstieg von der Basisnachfrage trennen. Viertens, beobachten Sie das Wetter. Heizgradtage (HDD) 1 Daten korrelieren mit dem Verbrauch von Kaminverbrauchsgütern. Kältere Winter verbrauchen den Lagerbestand schneller, und der erste signifikante Frost ist der psychologische Auslöser für die Wiederauffüllung des Kamins.
Ein einfaches Tracking-Framework
| Zu verfolgendes Muster | Granularität | Warum es für die Nachkaufprognose wichtig ist |
|---|---|---|
| Wöchentliche Stückverkäufe (Sep–Feb) | Wöchentlich | Erfasst die tatsächliche Nachfragekurve, nicht einen flachen Durchschnitt |
| Ausverkaufstage | Täglich | Verhindert eine Unterschätzung der tatsächlichen Nachfrage |
| Werbe- und Auslagungszeiträume | Wöchentlich | Trennt den Werbeeffekt von der Basisnachfrage |
| Regionale HDD / Datum des ersten Frosts | Wöchentlich | Erklärt frühe oder späte Saisonstarts |
| Kanalaufteilung (Einzelhandel, E-Commerce, Großhandel) | Monatlich | Jeder Kanal erreicht zu unterschiedlichen Zeiten seinen Höhepunkt |
Nach unserer Erfahrung beim Versand in die USA, nach Deutschland und Kanada können Käufer, die diese fünf Punkte verfolgen, die nächste Saison innerhalb eines angemessenen Rahmens vorhersagen. Käufer, die nur die gesamten Jahresverkäufe betrachten, bestellen normalerweise zu wenig – weil saisonalen Verkaufstrends komprimieren den Großteil des Risikos auf sechs oder acht Wochen.
Ein weiterer Punkt zu den Kaufmustern der Verbraucher: Käufer von Großpackungen zum Nachfüllen verhalten sich anders als Käufer von Geschenkkörben. Nachfüllkunden zeigen eine deutlich höhere jährliche Nachkaufwahrscheinlichkeit. Wenn Sie SKUs als Nachfüll- oder Dekorationsartikel kennzeichnen können, tun Sie dies. Ihre Nachkaufprognose sollte sich auf das Nachfüllsegment stützen, da Geschenkeempfänger mit viel geringerer Wahrscheinlichkeit zu Wiederholungskäufern werden.
Wie kann ich historische Bestelldaten verwenden, um genaue Nachbestellmengen bei meinem Lieferanten festzulegen?
Wenn wir ein neues Großhandelskonto aufnehmen, ist das Erste, wonach unser Verkaufsteam fragt, die Bestellhistorie von zwei Saisons. Nicht, weil wir neugierig sind – sondern weil es den gesamten Produktionsplan verändert.
Bereinigen Sie Ihre historischen Bestelldaten, indem Sie einmalige Ereignisse entfernen, geschätzte Umsatzeinbußen durch Fehlbestände wieder hinzufügen und Kanäle trennen. Wenden Sie dann eine Wachstumsrate basierend auf bestätigten Vertriebsänderungen an. Die angepasste Zahl – nicht die tatsächlich versandten Einheiten – wird zur Basis für Ihre Nachbestellmenge bei Ihrem Lieferanten.
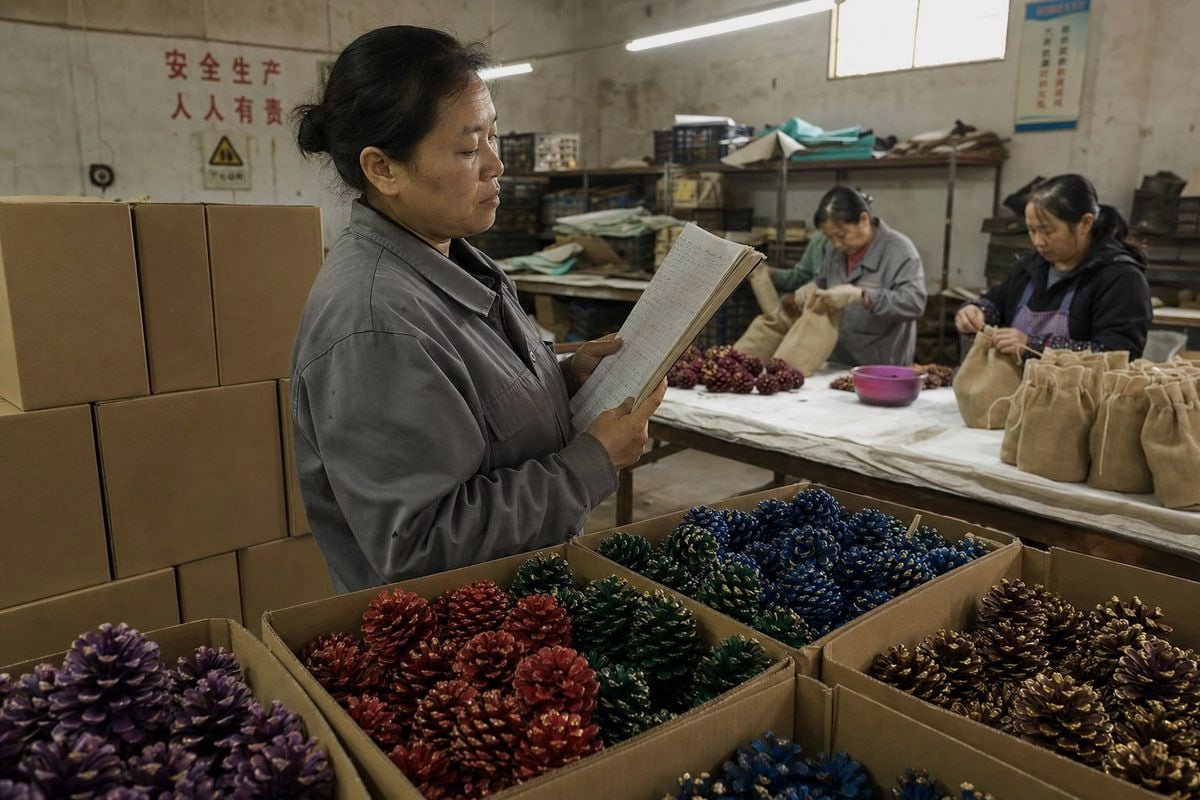
Die Analyse historischer Verkaufsdaten klingt kompliziert. Für dieses Produkt muss es das nicht sein. Sie arbeiten mit einem saisonalen Artikel, begrenzter Historie und unregelmäßigen Bestellungen. Einfache, disziplinierte Mathematik schlägt hier komplexe Modelle. Hier ist der Workflow, den wir unseren Vertriebspartnern empfehlen.
Eine Fünf-Schritte-Nachbestellungsberechnung
- Beginnen Sie mit den Stückverkäufen der letzten Saison. Verwenden Sie Durchverkauf 2, nicht Verkauf an den Handel. Was Einzelhändler von Ihnen gekauft haben, ist weniger wichtig als das, was die Verbraucher tatsächlich mit nach Hause genommen haben.
- Verluste wieder hinzufügen. Schätzen Sie die verlorenen Einheiten an Tagen mit Ausverkauf anhand Ihrer durchschnittlichen wöchentlichen Geschwindigkeit vor dem Ausverkauf. Dies ist die häufigste Korrektur, die Käufer überspringen.
- Einmalige Ereignisse entfernen. Ein viraler Social-Media-Post, ein Liquidationsrabatt oder ein Lagerfehler sollten Ihre Basislinie nicht aufblähen oder verringern.
- Wachstumsanpassung anwenden. Basieren Sie sie auf bestätigten Fakten: neue Filialen, ein neues Marktplatzangebot, eine erweiterte Region. Basieren Sie sie nicht auf Hoffnung.
- Szenarien schichten. Erstellen Sie einen konservativen, einen Basis- und einen optimistischen Wert. Bestellen Sie den Basisfall und vereinbaren Sie mit Ihrem Lieferanten die Kapazität für das Upside.
Arbeitsbeispiel
| Schritt | Berechnung | Einheiten |
|---|---|---|
| Durchverkauf der letzten Saison | Beobachtet | 000 Säcke |
| Ausgleich für Ausverkauf | +12 verlorene Tage × 150 Säcke/Tag | +1.800 Säcke |
| Entfernen Sie einmaligen Promo-Spitzenwert | Überschuss über Basislinie | −800 Säcke |
| Angepasste Basislinie | — | 000 Säcke |
| Wachstumsanpassung (neue Türen) | ×1.15 | 650 Säcke |
| Basis-Fall-Nachbestellmenge | Gerundet | 500–13.000 Säcke |
Manche Käufer wehren sich und sagen, eine einzige Wachstumsrate auf die Zahl des Vorjahres sei ausreichend. Andere bestehen darauf, dass ein Nischen-Feiertagsprodukt eine formelle statistische Prognose benötigt. Nach allem, was wir in über 30 Ländern sehen, gewinnt die ausgewogene Antwort: Beginnen Sie einfach, dann testen Sie. Wenn Ihre einfache Methode ein wiederkehrendes Muster verpasst hat – sagen wir, eine Spitze Anfang November in Deutschland, die in den USA nie auftritt –, fügen Sie für diesen Markt einen saisonalen Index hinzu. Fügen Sie nur dann Komplexität hinzu, wenn die Daten beweisen, dass das einfache Modell falsch ist. Prädiktive Analytik 3 für den Einzelhandel ist leistungsstark, aber mit zwei oder drei Saisons an Historie ist Disziplin wichtiger als Software.
Halten Sie außerdem Großhandels- und Einzelhandelsnachfrage in separaten Prognosen. Großhandelsaufträge kommen Monate im Voraus und in großen Mengen an. Das Vermischen mit täglichen E-Commerce-Verkäufen verfälscht beide Signale.
Welche Vorlaufzeiten und Mindestbestellmengen sollte ich bei der Planung meines jährlichen Tannenzapfenbestands berücksichtigen?
Unser Fabrikkalender erzählt hier die wahre Geschichte. Zapfensammlung, Behandlung mit Flammenfärberchemikalien 4, Trocknung, Verpackung und Compliance-Tests erfolgen alle Monate, bevor Ihre Regale Ware benötigen – und der Seefrachtverkehr fügt noch mehr Zeit hinzu.
Planen Sie eine Gesamtdurchlaufzeit von etwa 90–150 Tagen vom Kaufauftrag bis zu Ihrem Lager, einschließlich Produktion, Prüfung und Seefracht. Bestätigen Sie frühzeitig die MOQ Ihres Lieferanten pro SKU und das Verpackungsformat und geben Sie Ihre Hauptbestellung vor der Saison bis zum späten Frühjahr für den Regaltermin im Oktober auf.
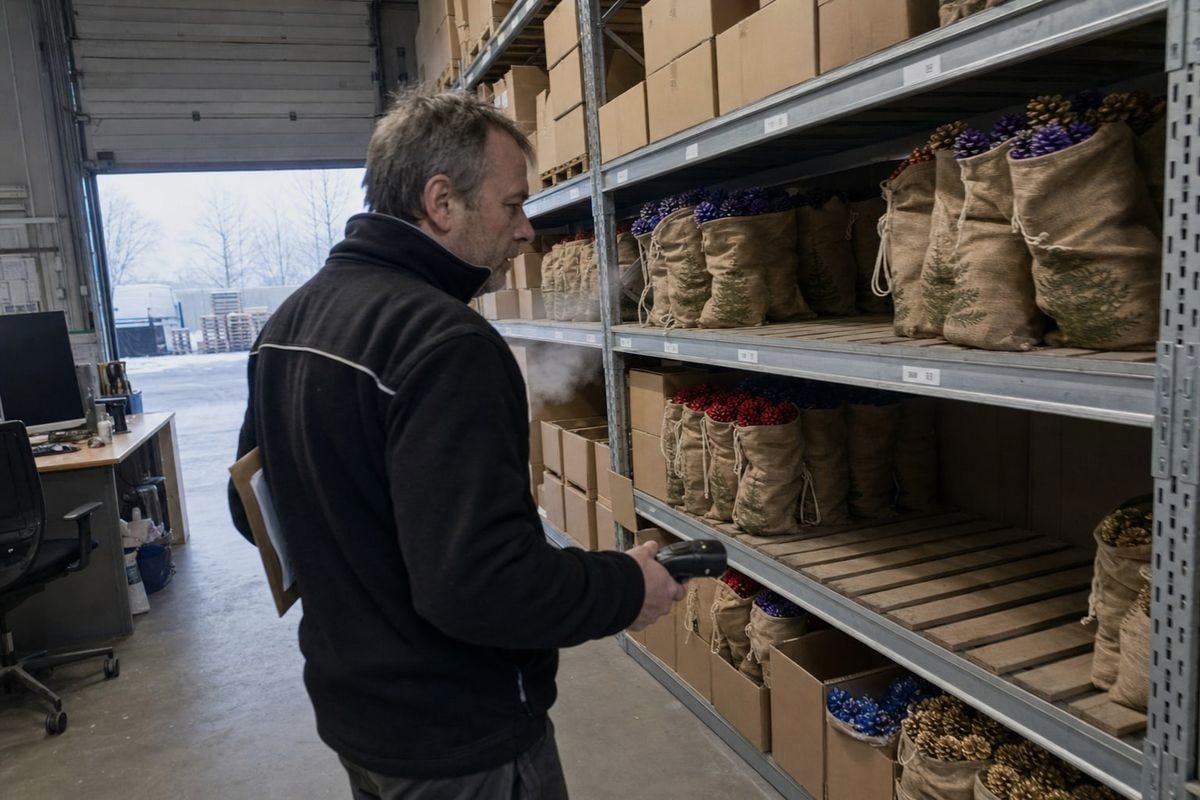
Die Vorlaufzeit ist, wo gute Prognosen sterben. Ich habe Käufer beobachtet, die ein ausgezeichnetes Nachfragemodell erstellt und dann im August ihre Bestellung aufgegeben und die halbe Saison verpasst haben. Lassen Sie mich also die Zeitachse so aufschlüsseln, wie wir sie intern planen.
Die tatsächliche Produktions-bis-Regal-Zeitachse
| Phase | Typische Dauer | Anmerkungen |
|---|---|---|
| Auftragsbestätigung und Musterung | 1–3 Wochen | Schneller, wenn die Eigenmarken-Grafik bereit ist |
| Produktion und Behandlung | 4–8 Wochen | Die Verfügbarkeit von Rohzapfen beeinflusst dies; Mastjahre erleichtern die Versorgung |
| Compliance-Tests und Qualitätskontrolle | 1–2 Wochen | SGS/Intertek-Berichte; Chargenprüfungen |
| Seefracht (China nach USA/EU) | 4–6 Wochen | Puffer für Hafenstaus im 3. Quartal hinzufügen |
| Zoll, Binnenverkehr, Wareneingang | 1–3 Wochen | Variiert je nach Markt |
Addieren Sie diese zusammen und Sie landen zwischen drei und fünf Monaten. Deshalb raten wir unseren Langzeitkunden, die Basisvolumina bis April oder Mai zu bestätigen und dann eine kleinere Option für die Nachschublieferung im November per Luftfracht oder Express-Seefracht, wenn die Saison heiß läuft.
MOQs und Sicherheitsbestand
MOQ-Gespräche sollten zur gleichen Zeit wie die Prognose geführt werden, nicht danach. An unserem Produktionsstandort Ningbo halten wir weil wir lieber eine zweite Saison verdienen, als eine überdimensionierte erste zu erzwingen. Sobald ein Käufer echte POS-Daten hat, können die Lagerauffrischungszyklen während Juni und Juli auf zweiwöchentliche Überprüfungen gestrafft werden. Wenden Sie , weil wir wissen, dass Einkaufsmanager einen Markt testen müssen, bevor sie sich festlegen. Aber sobald Sie skalieren, MOQ pro SKU 5 prägt Ihr Sortiment: Fünf Farben in drei Verpackungsformaten vervielfachen Ihre Mindestmengen schnell. Konsolidieren Sie, wo Sie können.
absorbiert Schwankungen in der Hauptsaison. Umlaufbestand ist das, was bereits auf dem Seeweg ist. Seefracht sollte die ersten beiden Schichten vor Beginn der Hauptsaison füllen. Luftfracht dient dazu, Löcher in der dritten Schicht zu stopfen, wenn die Realität den Plan überholt. 6 Niveaus für einen saisonalen Artikel folgen einer anderen Logik als ganzjährige Waren. Sie schützen nicht vor kontinuierlicher Nachfrageschwankung – Sie schützen vor einer großen Frage: Wird diese Saison kalt und stark oder mild und schwach? Eine praktische Regel ist, 15–25 % Ihrer Basisprognose als Sicherheitsbestand zu halten, gewichtet auf Ihre am schnellsten verkauften SKUs und Nachfüllformate. Ihr Lagerumschlagverhältnis 7 wird in einer Tabellenkalkulation während der Nebensaison schlecht aussehen, aber das ist die Natur der Kategorie. Beurteilen Sie den Umsatz über den gesamten saisonalen Zyklus, nicht pro Monat. Achten Sie auch auf angebotsseitige Faktoren: Zapfenertragszyklen variieren von Jahr zu Jahr, und starke Mastjahre können die Rohstoffkosten senken, während magere Jahre sie verteuern. Ein Lieferant mit echter Fertigungstiefe wird dies frühzeitig signalisieren; ein Handelsunternehmen kann dies normalerweise nicht.
Wie berücksichtige ich Markttrends und Veränderungen der Kundennachfrage bei der Prognose des Nachkaufbedarfs?
Eine britische Campingmarke, die wir beliefern, fragte uns letztes Jahr, ob DIY-Flammenfärbe-Tutorials in sozialen Medien ihren Wiederholungskäuferstamm schmälern würden. Es war eine berechtigte Frage – und die Antwort prägte ihre gesamte Bestellung.
Passen Sie Ihre Basisprognose an Trendtreiber an: Wachstum des Marktes für saisonale Heimdekoration, Änderungen in der Distribution, Wetterextreme, Risiko von DIY-Substitutionen und Farb-Mode-Zyklen. Quantifizieren Sie jede als prozentuale Anpassung, wenden Sie sie auf Ihre Lagerbestandsbereinigte Basis an und überprüfen Sie die Genauigkeit nach jeder Saison.

Trends sind, wo die Prognose aufhört, Arithmetik zu sein und Urteilsvermögen wird. Aber Urteilsvermögen braucht immer noch Struktur. Ich gruppiere Nachfrageschwankungen in drei Buckets: Rückenwind, Gegenwind und Hebel, die Sie kontrollieren.
Rückenwind und Gegenwind
Zu den Rückenwinden gehören das Wachstum im Markt für saisonale Wohndekoration 8, das steigende Interesse am Leben am Kamin und an Feuerstellen sowie die Erweiterung der Kategorie für Kamin- und Terrassenzubehör bei großen Einzelhändlern. Eine kältere als durchschnittliche Winterprognose ist ein weiterer Rückenwind – HDD-Projektionen sind es wert, jeden Herbst überprüft zu werden. Zu den Gegenwinden gehören milde Winter, Verluste von Einzelhandelsgeschäften und das Risiko der DIY-Substitution. Bastler, die Flammenfärbe-Tutorials verfolgen, versuchen vielleicht, behandelte Zapfen selbst herzustellen. Nach unserer Erfahrung verdrängt dies einen kleinen Bastleranteil, berührt aber selten den Mainstream-Geschenk- und Convenience-Käufer – die meisten Verbraucher werden keine Flammenfarbstoffe zu Hause handhaben, und compliance-bewusste Einzelhändler werden ohnehin keine zertifizierten hausgemachten Produkte lagern. Beachten Sie das Risiko, aber unterschätzen Sie es nicht.
Hebel, die Sie kontrollieren
Dies ist der Teil, den viele Käufer zu wenig nutzen. Sie können Wiederholungskäufe auslösen, anstatt sie nur vorherzusagen:
- Erfrischen Sie die Palette jährlich. Die Behandlung von gefärbten Kiefernzapfen als modenahes Dekorationsartikel – neue Farbkombinationen, goldspitzige Oberflächen, saisonale Metallic-Effekte – fördert den Wiederholungskauf, auch wenn alte Bestände vorhanden sind. Unsere OEM-Linie unterstützt aus genau diesem Grund kundenspezifische Farbmischungen.
- Setzen Sie First-Frost-Marketing ein. Automatisierte Nachbestellungs-E-Mails oder Anzeigen, die durch den ersten lokalen Temperaturabfall ausgelöst werden, fangen Kunden im psychologisch wichtigsten Moment ab.
- Drängen Sie Nachbestellungs-SKUs. Käufer von Nachbestellungen kaufen mit einer viel höheren Rate erneut, was Ihre Kundenbindung erhöht und die Prognose für das nächste Jahr stabiler macht.
- Testen Sie Abonnement- oder Bundle-Modelle. Eine saisonale "Kamin-Kit"-Reservierung sichert die Nachfrage, bevor Wettbewerber den Kunden erreichen.
Segmentieren Sie Ihre Zielgruppe zwischen Schenkenden und Selbstnutzern, wenn Sie diese Hebel anwenden. Selbstnutzer treiben den Wiederholungskauf an; Schenkende treiben die Akquisition an. Gewichtung Ihrer Wiederholungskaufprognose auf die Basis der Selbstnutzer, dann behandeln Sie das geschenkte Volumen als Neukundenzulauf, der im nächsten Jahr teilweise konvertiert. Schließen Sie schließlich den Kreis: Vergleichen Sie nach jeder Saison die Prognose mit den tatsächlichen Werten nach SKU und Kanal, dokumentieren Sie, was Sie verpasst haben, und speisen Sie es in die Anpassungen des nächsten Jahres ein. Die Genauigkeit der Prognose kumuliert sich Saison für Saison – aber nur, wenn Sie sie überprüfen.
Schlussfolgerung
Prognostizieren Sie die Nachfrage nach farbigen Tannenzapfen aus lagerbestandsbereinigten Q4-Verkäufen, fügen Sie saisonale und Trendanpassungen hinzu, und bestellen Sie dann frühzeitig mit Berücksichtigung von Vorlaufzeiten und Sicherheitsbeständen. Wenn Sie dies richtig machen, kumuliert sich jede Saison. Wenn Sie es falsch machen, verlieren Sie Ihre besten sechs Wochen. Arbeiten Sie mit einem Lieferanten zusammen, der dies mit Ihnen plant – so arbeiten wir.
Fußnoten
Stabile, maßgebliche Definition der HDD-Metrik für Energie- und wetterbasierte Nachfrageprognosen. ↩︎
Standard-Geschäftsdefinition aus einer zuverlässigen Quelle, die den unzugänglichen Investopedia-Link ersetzt. ↩︎
Hintergrund zu statistischen Prognosemethoden, die für die Nachfrageplanung referenziert werden. ↩︎
Maßgebliche Wikipedia-Eintragung, die die spezifischen Metallsalze beschreibt, die zur Erzeugung gefärbter Flammen verwendet werden.



 English
  Spanish
  German
  French
  Arabic
  Portuguese
Diskutieren Sie mit