






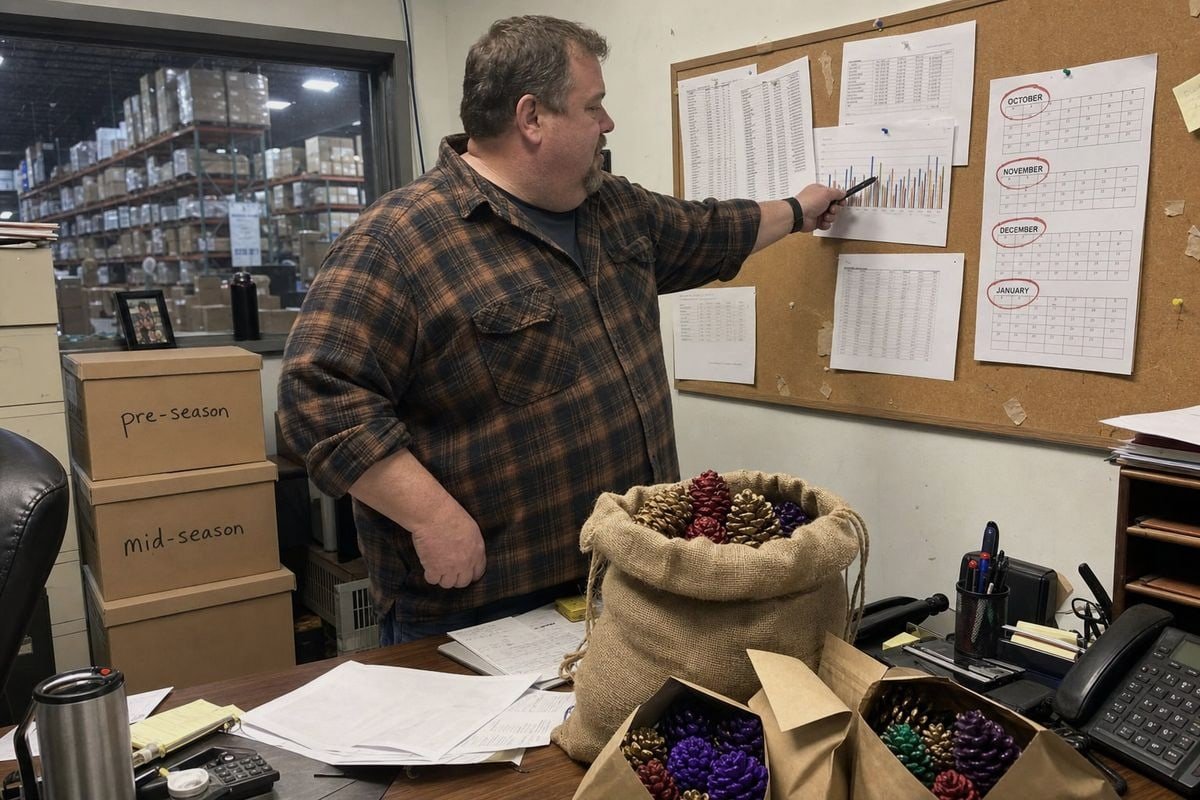
التنبؤ بالطلب السنوي المتكرر على مخاريط الصنوبر الملونة للمدفأة أمر صعب. يرى فريق الإنتاج لدينا أن المشترين يخمنون بشكل خاطئ كل عام - وتتزايد تكلفة التخمين الخاطئ.
للتنبؤ بالطلب السنوي لإعادة الشراء لأكواز الصنوبر الملونة للمدفأة، اجمع بيانات المبيعات للموسم الماضي مع تعديلات نفاد المخزون، والمؤشرات الموسمية لنافذة أكتوبر-يناير، ونمو التوزيع المتوقع، وأوقات تسليم الموردين. ثم قسّم الطلب إلى شرائح ما قبل الموسم ومنتصف الموسم مع مخزونات احتياطية.
هذا هو الجواب المختصر. الآن دعني أريك كل جزء، باستخدام ما نراه عبر أسواق التصدير لدينا كل موسم.
ما هي أنماط المبيعات الموسمية التي يجب أن أتعقبها للتنبؤ بحجم إعادة الشراء للعام المقبل؟
أخبرني موزع في بولندا ذات مرة أن مبيعات مخاريط الصنوبر الملونة لديه بدت "مسطحة" في نوفمبر. أظهرت سجلات الشحن لدينا السبب: لقد نفدت الكمية. بياناته أخفت منحنى الطلب الحقيقي.
تتبع مبيعات الوحدات الأسبوعية داخل نافذة الربع الرابع (أكتوبر-يناير)، حيث يتركز حوالي 80٪ من حجم المبيعات المتعلقة بالمدافئ. سجل تواريخ نفاد المخزون، وتوقيت العروض الترويجية، ومحفزات الصقيع الأولى، وتقسيمات القنوات. هذه الأنماط - وليس الإجماليات السنوية - تكشف عن حجم إعادة الشراء الحقيقي الذي تحتاجه للموسم القادم.

مخاريط الصنوبر الملونة للمدفأة هي عنصر ديكور موسمي للغاية ومنخفض التردد. المتوسطات السنوية ستضللك. المنتج يباع في نافذة ضيقة، ويبقى بالقرب من الصفر بقية العام، ويتفاعل بقوة مع الطقس. لذلك يجب أن تتطابق الأنماط التي تتتبعها مع هذا الواقع.
الأنماط الأربعة الأكثر أهمية
أولاً، تتبع مبيعات الوحدات الأسبوعية من سبتمبر إلى فبراير. غالبًا ما تكون البيانات الشهرية خشنة جدًا. يمكن أن تؤدي موجة البرد في الأسبوع 44 إلى نقل المزيد من الأكياس أكثر من شهر أكتوبر بأكمله. ثانيًا، سجل كل يوم نفدت فيه المخزون. إذا نفدت منك الكمية في 10 ديسمبر، فإن مبيعات ديسمبر الخاصة بك تقلل من الطلب الحقيقي - وأحيانًا بشكل كبير. ثالثًا، لاحظ توقيت العروض الترويجية والعروض. يمكن لعرض نهاية الرف بالقرب من ممر المدفأة والفناء أن يضاعف السرعة الأسبوعية، وتحتاج إلى فصل هذا الارتفاع عن الطلب الأساسي. رابعًا، راقب الطقس. أيام التدفئة (HDD) 1 ترتبط البيانات بالاستهلاك للمواد الاستهلاكية للمدفأة. الشتاء الأكثر برودة يحرق المخزون بشكل أسرع، وأول صقيع كبير هو المحفز النفسي لإعادة تخزين المدفأة.
إطار عمل تتبع بسيط
| نمط للتتبع | دقة | لماذا هو مهم للتنبؤ بإعادة الشراء |
|---|---|---|
| مبيعات الوحدات الأسبوعية (سبتمبر - فبراير) | أسبوعي | يلتقط منحنى الطلب الحقيقي، وليس متوسطًا مسطحًا |
| أيام نفاد المخزون | يوميًا | يمنع التقليل من تقدير الطلب الحقيقي |
| نوافذ العروض الترويجية والعروض | أسبوعي | يفصل بين الارتفاع الترويجي والطلب الأساسي |
| أيام التدفئة الإقليمية / تاريخ أول صقيع | أسبوعي | يفسر بدايات الموسم المبكرة أو المتأخرة |
| تقسيم القناة (التجزئة، التجارة الإلكترونية، البيع بالجملة) | شهري | كل قناة تصل إلى ذروتها في أوقات مختلفة |
في تجربتنا في الشحن إلى الولايات المتحدة وألمانيا وكندا، يمكن للمشترين الذين يتتبعون هذه العناصر الخمسة التنبؤ بالموسم القادم ضمن نطاق معقول. المشترون الذين ينظرون فقط إلى إجمالي المبيعات السنوية يعيدون طلب كميات قليلة جدًا - لأن اتجاهات المبيعات الموسمية ضغط معظم المخاطر في ستة أو ثمانية أسابيع.
نقطة أخرى حول أنماط شراء المستهلكين: المشترون الذين يشترون أكياس "إعادة التعبئة" بكميات كبيرة يتصرفون بشكل مختلف عن مشترين الهدايا. يُظهر عملاء إعادة التعبئة احتمالية إعادة شراء سنوية أعلى بشكل ملحوظ. إذا كان بإمكانك تمييز وحدات SKU على أنها إعادة تعبئة مقابل زخرفية، فافعل ذلك. يجب أن يعتمد توقع إعادة الشراء الخاص بك على شريحة إعادة التعبئة، لأن متلقي الهدايا يتحولون إلى مشترين متكررين بمعدل أقل بكثير.
كيف يمكنني استخدام بيانات الطلبات التاريخية لتحديد كميات إعادة الطلب الدقيقة مع المورد الخاص بي؟
عندما نقوم بضم حساب جديد للبيع بالجملة، فإن أول شيء يطلبه فريق المبيعات لدينا هو تاريخ طلب موسمين. ليس لأننا فضوليون - لأنه يغير خطة الإنتاج بأكملها.
نظّف بيانات طلباتك التاريخية عن طريق إزالة الأحداث الفريدة، وإعادة إضافة المبيعات المفقودة المقدرة بسبب نفاد المخزون، وفصل القنوات. ثم قم بتطبيق معدل نمو بناءً على تغييرات التوزيع المؤكدة. يصبح الرقم المعدل - وليس وحدات الشحن الخام - هو خط الأساس لكمية إعادة الطلب الخاصة بك مع المورد الخاص بك.

يبدو تحليل بيانات المبيعات التاريخية معقدًا. بالنسبة لهذا المنتج، لا يلزم أن يكون كذلك. أنت تعمل مع عنصر موسمي، وتاريخ محدود، وطلبات متقطعة. الرياضيات البسيطة المنضبطة تتفوق على النماذج المعقدة هنا. إليكم سير العمل الذي نوصي به لشركائنا الموزعين.
حساب إعادة الطلب بخمس خطوات
- ابدأ بمبيعات الموسم الماضي. استخدم البيع بالتجزئة 2, ، وليس البيع للموزع. ما اشتراه تجار التجزئة منك يهم أقل مما أخذه المستهلكون بالفعل إلى المنزل.
- أضف المبيعات المفقودة. قدّر الوحدات المفقودة أثناء أيام نفاد المخزون باستخدام متوسط سرعتك الأسبوعية قبل نفاد المخزون. هذا هو التصحيح الأكثر شيوعًا الذي يتخطاه المشترون.
- قم بإزالة الأحداث لمرة واحدة. لا ينبغي لمنشور اجتماعي فيروسي، أو خصم تصفية، أو خطأ في المستودع أن يضخم أو يقلل من خط الأساس الخاص بك.
- قم بتطبيق تعديل النمو. استند إلى حقائق مؤكدة: أبواب متاجر جديدة، قائمة سوق جديدة، منطقة موسعة. لا تستند إلى الأمل.
- قم بتطبيق السيناريوهات. قم ببناء رقم متحفظ، أساسي، ومتفائل. اطلب الحالة الأساسية، واتفق مع المورد الخاص بك على القدرة على تحقيق الأفضل.
مثال عملي
| خطوة | حساب | وحدات |
|---|---|---|
| البيع بالتجزئة للموسم الماضي | Observed | 10,000 bags |
| Stockout adjustment | +12 lost days × 150 bags/day | +1,800 bags |
| Remove one-off promo spike | Excess above baseline | −800 bags |
| Adjusted baseline | — | 11,000 bags |
| Growth adjustment (new doors) | ×1.15 | 12,650 bags |
| Base-case reorder quantity | Rounded | 12,500–13,000 bags |
Some buyers push back and say a single growth rate on last year's number is enough. Others insist a niche holiday product needs formal statistical forecasting. From what we see across 30+ countries, the balanced answer wins: start simple, then backtest. If your simple method missed a recurring pattern — say, an early-November spike in Germany that never shows in the US — add a seasonal index for that market. Only add complexity when the data proves the simple model is wrong. Predictive analytics 3 for retail is powerful, but with two or three seasons of history, discipline matters more than software.
Also, keep wholesale and retail demand in separate forecasts. Wholesale orders arrive months early and in large lumps. Mixing them with daily ecommerce sales corrupts both signals.
ما هي المهلة الدنيا والحد الأدنى لكميات الطلب التي يجب أن آخذها في الاعتبار عند التخطيط لمخزون مخروط الصنوبر السنوي الخاص بي؟
Our factory calendar tells the real story here. Pine cone collection, treatment with مواد تلوين اللهب 4, drying, packaging, and compliance testing all happen months before your shelves need stock — and ocean freight adds more time on top.
خطط لوقت تسليم إجمالي يتراوح تقريبًا بين 90 و 150 يومًا من أمر الشراء إلى مستودعك، ويشمل الإنتاج والاختبار والشحن البحري. أكد الحد الأدنى لكمية الطلب لموردك لكل وحدة تخزين وتنسيق التعبئة مبكرًا، وقدم طلبك الرئيسي قبل الموسم في أواخر الربيع لتاريخ رفوف أكتوبر.

Lead time is where good forecasts die. I have watched buyers build an excellent demand model, then place their order in August and miss half the season. So let me break the timeline down the way we plan it internally.
The real production-to-shelf timeline
| المدة النموذجية | المدة النموذجية | مصادر الأكواز الخام |
|---|---|---|
| تأكيد الطلب وأخذ العينات | موافقة العينة وتأكيد أمر الشراء | Faster if private-label artwork is ready |
| Production and treatment | 4-8 أسابيع | Raw cone availability affects this; masting years ease supply |
| Compliance testing and QC | 1-2 أسابيع | SGS/Intertek reports; batch-level checks |
| الشحن البحري (الصين إلى الولايات المتحدة/الاتحاد الأوروبي) | 4-6 أسابيع | Add buffer for port congestion in Q3 |
| Customs, inland transport, receiving | موافقة العينة وتأكيد أمر الشراء | يختلف حسب السوق |
Add these up and you land between three and five months. That is why we advise our long-term accounts to confirm base-case volumes by April or May, then hold a smaller mid-season tranche option for November replenishment by air or express sea if the season runs hot.
MOQs and safety stock
MOQ conversations should happen at the same time as forecasting, not after. At our Ningbo production site, we keep الحد الأدنى لكميات الطلب مرنة لطلبات التجربة because we know purchasing managers need to test a market before committing. But once you scale, MOQ per SKU 5 shapes your assortment: five colors in three packaging formats multiplies your minimums fast. Consolidate where you can.
مخزون الأمان 6 levels for a seasonal item follow a different logic than year-round goods. You are not protecting against continuous demand variation — you are protecting against one big question: will this season be cold and strong, or mild and weak? A practical rule is to hold 15–25% of your base forecast as safety stock, weighted toward your fastest-moving SKUs and refill formats. Your نسبة دوران المخزون 7 will look poor in a spreadsheet during the off-season, but that is the nature of the category. Judge turnover across the full seasonal cycle, not by month. Also watch supply-side factors: pine cone crop cycles vary year to year, and heavy masting years can ease raw material costs while lean years tighten them. A supplier with real manufacturing depth will flag this early; a trading company usually cannot.
كيف يمكنني مراعاة اتجاهات السوق وتغيرات طلب العملاء عند التنبؤ باحتياجات إعادة الشراء؟
A UK camping brand we supply asked us last year whether DIY flame-coloring tutorials on social media would eat into their repurchase base. It was a fair question — and the answer shaped their whole order.
اضبط توقعاتك الأساسية لمحركات الاتجاه: نمو سوق ديكور المنزل للعطلات، وتغييرات التوزيع، وشدة الطقس، ومخاطر استبدال الأعمال اليدوية، ودورات الموضة اللونية. قم بقياس كل منها كنسبة تعديل، وطبقها على خط الأساس المصحح لنفاد المخزون، وراجع الدقة بعد انتهاء كل موسم.

Trends are where forecasting stops being arithmetic and starts being judgment. But judgment still needs structure. I group demand shifts into three buckets: tailwinds, headwinds, and levers you control.
Tailwinds and headwinds
Tailwinds include growth in the holiday home decor market 8, rising interest in fireplace and fire pit living, and expansion of the hearth and patio accessories category at big-box retailers. A colder-than-average winter forecast is another tailwind — HDD projections are worth checking each autumn. Headwinds include mild winters, retail door losses, and the DIY substitution risk. Hobbyists who watch flame-coloring tutorials may try making treated cones themselves. In our experience, this cannibalizes a small hobbyist slice but rarely touches the mainstream gift and convenience buyer — most consumers will not handle flame colorant chemicals at home, and compliance-conscious retailers will not stock uncertified homemade products anyway. Note the risk, but do not over-discount for it.
Levers you control
This is the part many buyers underuse. You can trigger repurchases rather than just predict them:
- Refresh the palette annually. Treating colored pine cones as a fashion-adjacent decor item — new color combinations, gold-tipped finishes, seasonal metallics — prompts repurchase even when old stock remains. Our OEM line supports custom color mixes for exactly this reason.
- Deploy first-frost marketing. Automated replenishment emails or ads triggered by the first local temperature drop catch customers at the peak psychological moment.
- Push refill SKUs. Refill buyers repurchase at a much higher rate, which lifts your customer retention rate and makes next year's forecast more stable.
- Test subscription or bundle models. A pre-season "hearth kit" reservation locks in demand before competitors reach the customer.
Segment your audience between gifters and self-users when you apply these levers. Self-users drive repurchase; gifters drive acquisition. Weight your repurchase forecast toward the self-user base, then treat gift-driven volume as new-customer inflow that partially converts next year. Finally, close the loop: after every season, compare forecast to actuals by SKU and channel, document what you missed, and feed it into next year's adjustments. Forecast accuracy compounds season over season — but only if you review it.
خاتمة
Forecast colored pine cone demand from stockout-corrected Q4 sell-through, add seasonal and trend adjustments, then order early with lead times and safety stock built in. Get this right, and every season compounds. Get it wrong, and you lose your best six weeks. Partner with a supplier who plans it with you — that is how we work.
ملاحظات ختامية
1. Stable, authoritative definition of the HDD metric used for energy and weather-based demand forecasting. ↩︎
2. Standard business definition from a reliable source, replacing the inaccessible Investopedia link. ↩︎
3. Background on statistical forecasting methods referenced for demand planning. ↩︎
4. Authoritative Wikipedia entry detailing the specific metal salts used to produce colored flames.



 English
  Spanish
  German
  French
  Arabic
  Portuguese
انضم إلى المحادثة