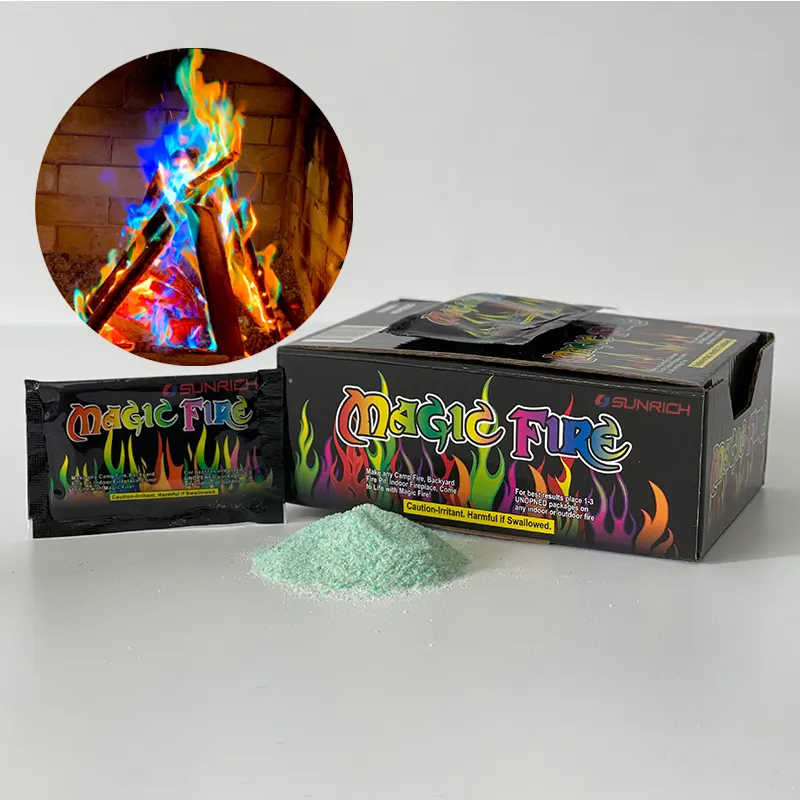

Using past camping equipment 1 sales curves to estimate Magic Fire Powder order quantity is a question our production team hears from buyers every spring, usually after a painful stockout or overstock.
Use past camping equipment sales curves as a seasonal baseline: convert monthly sales into seasonality factors, adjust for growth and abnormal years, then calculate order quantity as expected demand during lead time plus safety stock, minus on-hand and inbound inventory. Historical curves set timing and shape; buffers handle uncertainty.
That formula sounds simple. The hard part is doing each step correctly. Below, I break down the full workflow, with tables and examples you can copy into a spreadsheet today.
What Seasonal Sales Patterns Should I Track to Forecast My Magic Fire Powder Demand?
A distributor in Poland once showed me his tent sales chart and asked if it could predict color-flame packet demand. The short answer from our export data: mostly yes, with adjustments.
Track monthly category sales for at least 24 months, focusing on the January-to-July climb, the June-August primary peak, the October trough, and a secondary Q4 gift-season bump. Overlay holiday weekends like Memorial Day, which can spike demand and deplete stock within 48–72 hours.
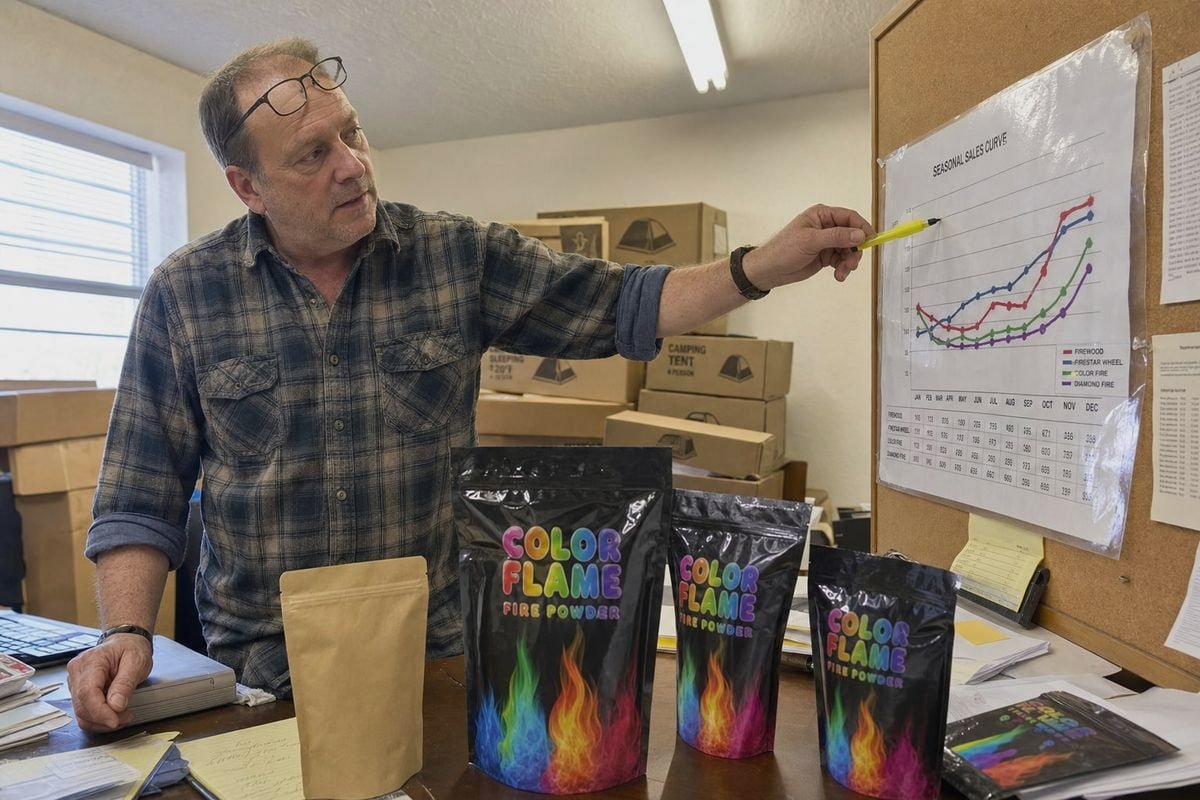
Camping demand is not random. Analyse historischer Verkaufsdaten across the category shows a reliable shape: interest builds from January, accelerates through late spring, peaks in summer, and softens in fall and winter. Industry reports consistently show Q2 and Q3 generating the majority of annual revenue. One category analysis found camping gear purchases 2 jumping from roughly 13 million monthly sales to more than 19.5 million around Memorial Day 2021. That is the kind of holiday amplification you must plan for.
The Patterns That Matter Most
For a color-flame consumable like Magic Fire Powder, I tell buyers to track four distinct layers of the curve, because each drives a different ordering decision.
| Pattern to Track | Typische Zeitplanung | Why It Matters for Ordering |
|---|---|---|
| Primary summer peak | Juni–August | Sets your largest PO; peak camping season trends drive 50–60% of annual volume |
| Secondary gift peak | Oktober–Dezember | Justifies premium gift-box SKUs, not bulk sachets |
| Spring ramp-up | January–May | Defines when containers must ship from our Ningbo facility |
| Trough months | September–October, January | When to run down stock and protect Lagerumschlagverhältnis 3 |
Anchor Products as Leading Indicators
Fire powder is an accessory. Its demand follows anchor products like tents and portable fire pits, usually with a short lag. If your fire pit sell-through rate rises in April, expect powder demand to follow in May and June. We have seen this basket relationship repeat across our US and German customers for years. Also watch weather: an unseasonably warm spring or dry autumn can extend the campfire season by 15–20%, and burn-permit restrictions can throttle it just as fast.
How Do I Convert My Camping Gear Sales Data Into an Accurate Order Quantity for Color-Flame Products?
There is a trade-off I weigh with every OEM client: order tight to the forecast and risk stockouts at peak, or pad the order and tie up cash. A structured conversion method reduces that tension.
Convert sales data in five steps: build a monthly baseline curve, index each month against the annual average for seasonality factors, apply a growth trend, clean out abnormal events like stockouts or promotions, then compute order quantity as lead-time demand plus safety stock minus current and inbound inventory.

This is saisonale Nachfrageprognose 4 in its most practical form. You do not need predictive analytics for retail at enterprise scale. A spreadsheet works fine for one or two SKUs. Here is the workflow I walk buyers through when they place their first container order with us.
The Five-Step Conversion Process
- Build the baseline. Pull monthly sales for your closest proxy category (fire pits, firestarters, or camping accessories) for 24–36 months.
- Index each month. Divide each month's sales by the monthly average. July might index at 1.8; October at 0.5. These are your seasonality factors.
- Apply a trend factor. If your channel grew 15% last year and nothing major changed, multiply the baseline by 1.15. Treat market CAGR reports as directional only, because they disagree widely.
- Clean abnormal periods. Down-weight COVID-era spikes, months you were out of stock, and months with heavy promotions. A stockout month understates true demand; a promotion month overstates it.
- Calculate the order. Forecasted order quantity = expected demand during lead time + Sicherheitsbestand 5 − on-hand inventory − inbound inventory.
Ein bearbeitetes Beispiel
| Eingabe | Wert |
|---|---|
| Average monthly baseline demand | 2,000 packets |
| June seasonality factor | 1.6 |
| Growth trend factor | 1.15 |
| Forecast June demand | 2,000 × 1.6 × 1.15 = 3,680 packets |
| Lead time (production + ocean freight) | 60 days ≈ 2 months (June + July forecast) |
| Lead-time demand (June + July) | ~7,700 packets |
| Safety stock (25%) | ~1,925 packets |
| Auf Lager + eingehend | 2,500 packets |
| Bestellmenge | ~7,125 packets |
One more layer matters: SKU format. Six-pack impulse buys sell through fast in summer retail; 50-pack bulk formats move slower and drag margin if overstocked. Split your forecast by format before you finalize the PO, and set a Bestellpunktberechnung for each one separately.
Can I Use Last Year's Sales Curves to Set the Right MOQ for My First Magic Fire Powder Trial Order?
Last month, a UK fireplace distributor asked us exactly this before his first trial order. He had strong firestarter data but zero color-flame history. Our answer shaped his whole launch plan.
Yes, but use the curve for timing, not volume. For a first trial order, size the MOQ at 8–12 weeks of conservatively estimated sell-through, using a basket-ratio from anchor products like fire pits, and schedule arrival at least four weeks before your seasonal peak.
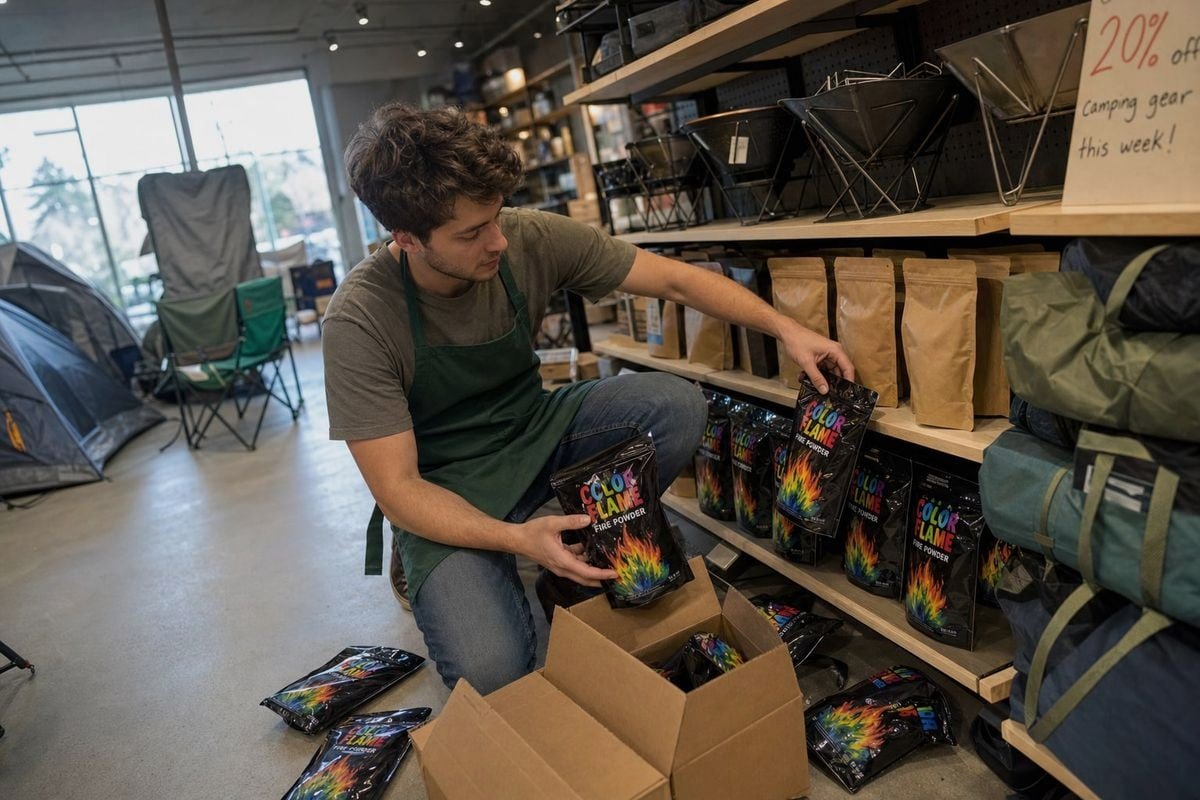
A trial order is a learning exercise, not a profit maximizer. Your camping equipment sales curves tell you three things reliably for a new SKU: when demand will start, when it will peak, and roughly how it will decay. They do not tell you the absolute quantity, because attachment behavior for a novelty consumable differs from gear. So I recommend basket-ratio forecasting instead. Look at your historical attachment rates for comparable accessories. If firestarters attached to 20% of fire pit sales, assume color-flame powder starts lower, perhaps 5–10%, and let the trial prove the real number.
How We Structure Trial Orders at Our Factory
Flexible MOQs for trial orders are a deliberate part of how we work with new B2B partners. In 17+ years of exporting to 30+ countries, we have learned that a right-sized first order builds a longer relationship than a padded one. A few practical points from our side of the table:
- Our first sample reliably reflects Vereinbaren Sie die Bulk-Konditionen, bevor Sie den Test bestellen. In unserer Fabrik bieten wir Test- und Volumenpreise zusammen an, sodass der Käufer genau weiß, welche Stufe er nach der Validierung freischaltet. Da unsere Chargen-zu-Chargen-Qualitätskontrolle streng ist, spiegelt die Testprobe zuverlässig die 6, because we run strict batch-to-batch quality control on complete in-house production lines. That means your trial sell-through data is valid for scaling, not distorted by quality drift.
- Packaging format affects trial economics. A kraft bag or foil sachet trial costs less per unit than jars with custom display boxes, so many buyers trial in sachets and scale into retail-ready packaging.
- Compliance documents (ISO 9001 7, BSCI, CE, SGS/Intertek test reports) should be confirmed before the trial, not after. Retail sourcing channels will ask for them the moment your trial succeeds.
- Time the trial to land four to six weeks before your peak window. A trial arriving in August misses the summer curve and gives you misleading sell-through data.
One caution: if your business changed channels recently, say from wholesale to DTC, last year's curve may mislead you. Channel mix changes both the shape and the margin math, so re-baseline before you commit.
What Buffer Stock Should I Add When My Sales Forecast Doesn't Match Actual Camping Season Trends?
Years ago, a Canadian client taught me an expensive lesson: he forecast perfectly on annual volume but mistimed the peak, and half his stock arrived after Labor Day. Buffers exist for exactly this.
Add safety stock of 20–30% of lead-time demand for seasonal color-flame products, scaling higher before summer peaks and holiday weekends, and lower after August. Size the buffer to cover lead time variability, forecast error, and weather-driven season extensions of 15–20%.
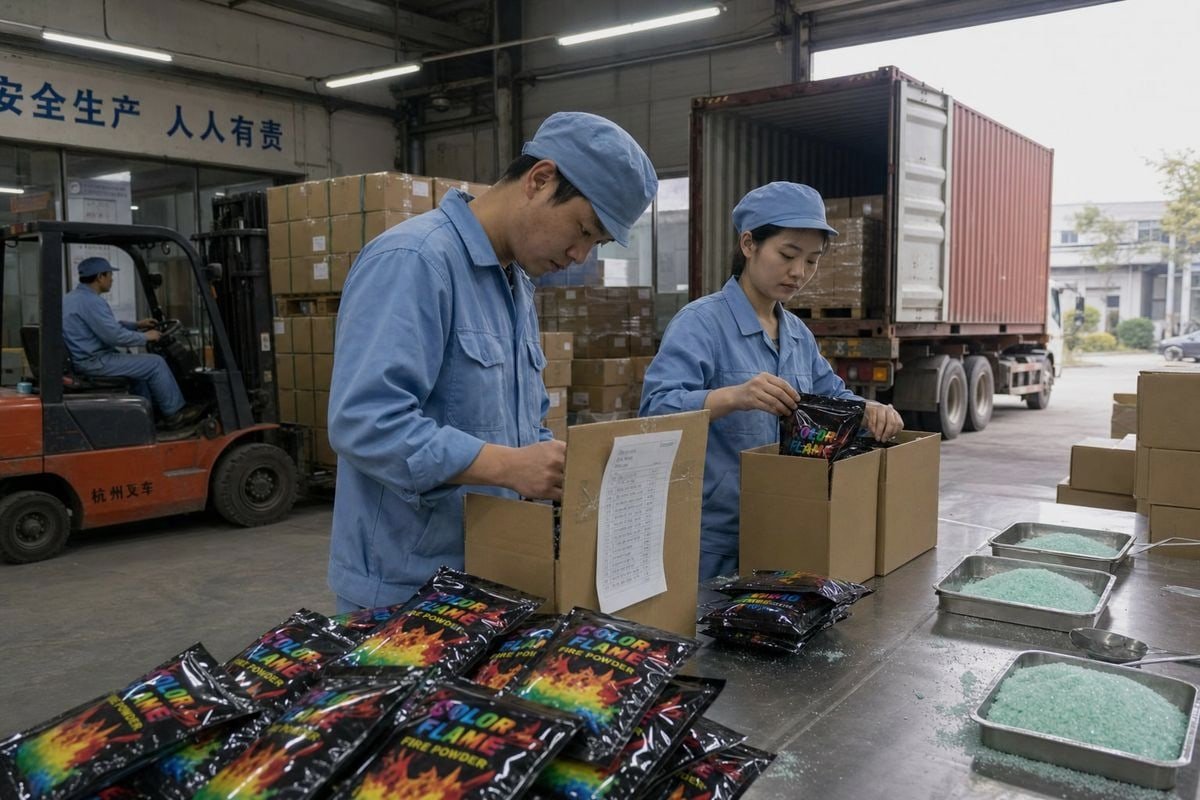
Sicherheitsbestand are not one fixed percentage. They should flex with where you are in the season and how uncertain each demand driver is. The biggest mistake I see is not ordering too much or too little overall. It is ordering at the wrong time relative to the peak. Stockout prevention in June is worth far more than in October, because a June stockout costs you the highest-velocity weeks of the year and hands shelf space to a competitor.
Sizing the Buffer by Risk Source
| Risk Source | Typische Auswirkung | Suggested Buffer Response |
|---|---|---|
| Forecast error on a new SKU | ±30% or more | Higher buffer (25–30%) until two seasons of data exist |
| Lead time variability (production + ocean freight) | 1–3 weeks slippage | Add one extra week of demand per week of typical variance |
| Holiday spikes (Memorial Day, July 4th) | Stock gone in 48–72 hours | Pre-position holiday stock 4+ weeks early |
| Weather extension of campfire season | +15–20% demand | Hold a mid-season reorder option instead of front-loading |
| Viral social trends (aesthetic campfire content) | Sudden multi-week surge | Monitor hashtags; apply a trend multiplier to reorders, not the base PO |
Buffers Should Shrink After the Peak
After August, cut buffers aggressively. Post-peak overbuying is the silent killer of inventory turnover ratio for seasonal goods, because leftover summer stock sits until spring. The smarter move is a two-stage plan: a main pre-season order with full safety stock, then a smaller, optional mid-season reorder triggered by actual sell-through against a preset reorder point. Real-time signals like regional burn-permit data and campfire restriction levels can act as a demand throttle, telling you whether to pull that trigger or hold. From our side, we keep production scheduling and lead times consistent precisely so that mid-season reorders remain a realistic option for our partners rather than a gamble.
Schlussfolgerung
Past camping equipment sales curves give you the shape and timing of Magic Fire Powder demand. Add trend adjustments, seasonal safety stock, and disciplined reorder points to turn that curve into confident purchase orders.
Fußnoten
1. Official U.S. National Park Service guide detailing essential camping equipment and supplies. ↩︎
2. Provides industry context for the scale of camping equipment sales during peak seasons. ↩︎
3. Authoritative Wikipedia entry explaining the calculation and significance of inventory turnover. ↩︎
4. Explains the process of predicting future demand based on historical seasonal patterns. ↩︎
5. Explains the inventory management concept of maintaining extra stock to mitigate risk. ↩︎
6. Describes the consistency of quality required for large-scale manufacturing of consumer goods. ↩︎
7. Official Wikipedia overview of the ISO 9001 quality management system standards. ↩︎



 English
 Spanish
 German
 French
 Arabic
 Portuguese
Diskutieren Sie mit