






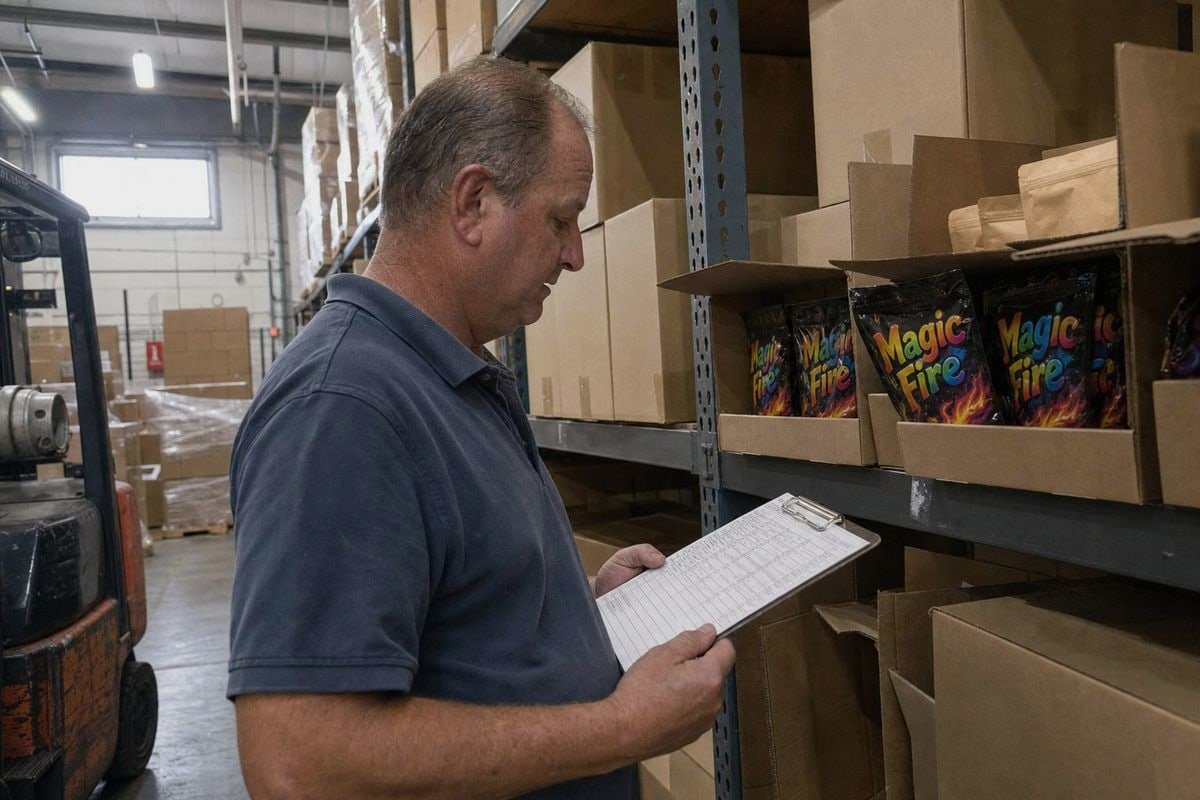
إعداد مخزون الأمان 1 levels for Magic Fire powder trips up even seasoned importers. I've watched buyers on our production schedule run dry mid-season because they buffered only for factory time — freight variability quietly wiped out their shelf availability, and lost peak-season sales never come back.
Safety stock levels for Magic Fire powder should cover total replenishment lead time — production plus ocean transit plus customs — not factory time alone. Use the formula Z × √((LT × σD²) + (Davg² × σLT²)) with a 95–99% service level, then recalculate quarterly using actual delivery history.
That formula looks dense, but it breaks down into simple parts. Below, I walk through each one: the calculation itself, production timing in Liuyang, ocean freight risk, and how MOQ fits into the picture.
What Formula Should I Use to Calculate Safety Stock for Magic Fire Powder Orders?
A German distributor once asked me why his buffer kept failing. We reviewed his numbers together at our Ningbo facility — he was using average demand and average lead time, nothing more.
Use Safety Stock = Z × √((LT × σD²) + (Davg² × σLT²)), where LT is total production-plus-transit lead time in days, σD is the standard deviation of daily demand, Davg is average daily demand, and σLT is lead time standard deviation. This covers both demand and supply chain variability.

The right formula depends on how stable your demand and your supply chain actually are. In my experience shipping color-flame packets to 30+ countries, very few buyers have both stable demand and stable transit times. So let me lay out the options honestly.
The Four Main Formulas Compared
| صيغة | متى تستخدم | نقطة الضعف |
|---|---|---|
| Z × σD × √LT | Demand varies, lead time is stable | Ignores transit time uncertainty |
| Z × σLT × Davg | Lead time varies, demand is flat | Ignores demand spikes |
| Z × √((LT × σD²) + (Davg² × σLT²)) | Both vary — most import scenarios | Needs clean historical data |
| (Max Demand × Max Lead Time) − (Avg Demand × Avg Lead Time) | Quick conservative estimate | Can overstock badly |
For most of our wholesale buyers, the combined statistical formula wins. Fire-color products sell seasonally — camping season, holiday gifting, festival periods — so the standard deviation of demand is high. Meanwhile, ocean lanes from China fluctuate. Both sources of variability compound, and the statistical model captures that compounding.
Choosing Your Z-Score
Your Z-score comes from your service level target. Here is the standard translation:
| Service Level | Z-Score | المعنى العملي |
|---|---|---|
| 90% | 1.28 | Acceptable for slow SKUs |
| 95% | 1.65 | Standard for core products |
| 98% | 2.05 | Peak-season protection |
| 99% | 2.33 | Never-stockout SKUs |
A higher service level cuts stockout risk but raises inventory carrying costs. My advice: run a stockout risk assessment per SKU. Your best-selling pouch format deserves 98%; a slow jar variant might only need 90%. Segmenting buffers by SKU beats one universal number every time.
One warning from experience: measure lead time from actual purchase orders, not from quoted timelines. Quoted lead times almost always understate real replenishment time.
How Do Production Lead Times in Liuyang Affect My Reorder Timing?
Our headquarters sits in Liuyang, Hunan — China's fire-products cluster — with production lines in Ningbo. That geography shapes every delivery promise we make to importers.
Production lead time drives the front half of your reorder point calculation. Standard color-flame powder runs take 20–35 days, extending during pre-season peaks and Chinese New Year. Your reorder point equals (average daily demand × total lead time) plus safety stock.
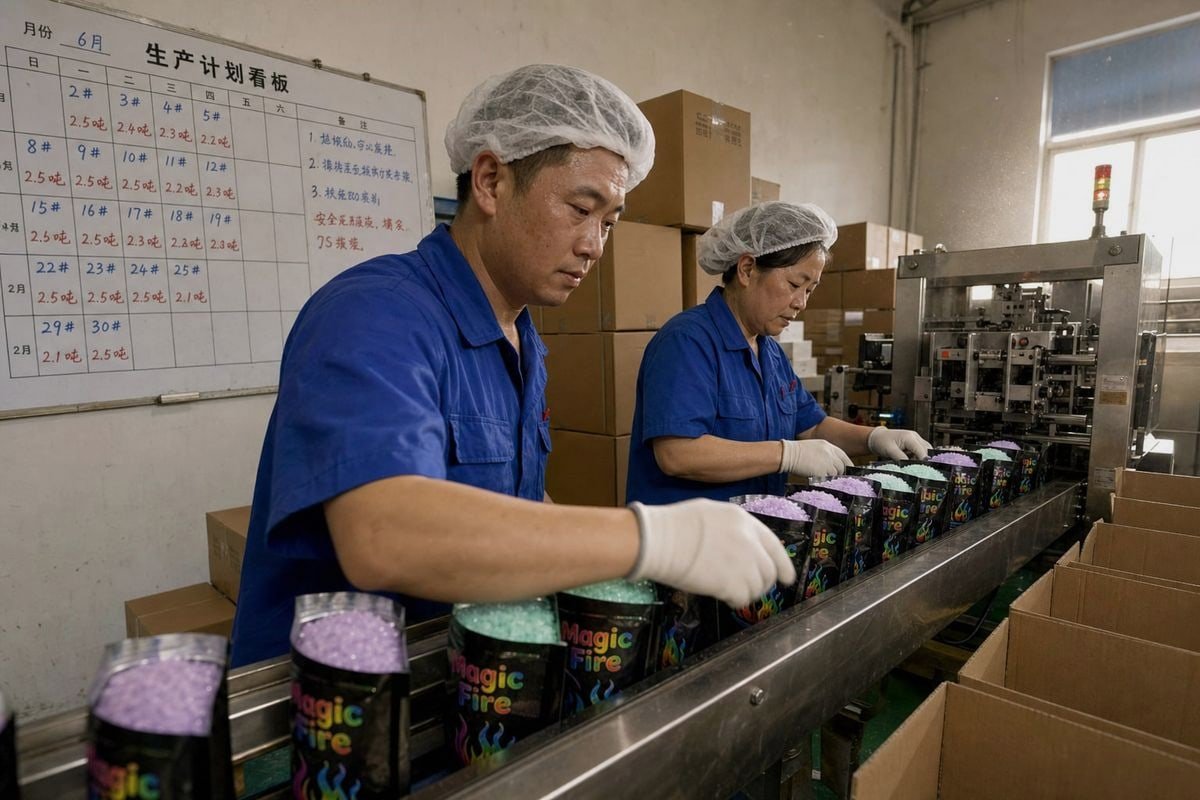
After 17+ years running production lines, I can tell you that factory lead time is not one number. It is a range shaped by order complexity, season, and compliance steps. Understanding those drivers lets you set a نقطة إعادة الطلب 3 that actually works.
What Drives Production Time Up or Down
A plain repeat order of stock-design foil pouches moves fast. But most of our B2B buyers order private-label goods. Custom packaging changes the math. Printed pouches, custom display boxes, barcodes, and market-specific warning labels each add setup time. Then quality control adds more: we run batch-to-batch checks so the mass-production shipment matches the approved sample, and we hold goods for SGS or Intertek testing when a buyer's retail channel requires fresh reports. Those steps protect you at the shelf, but they belong in your lead time demand calculation, not outside it.
Seasonality matters even more. عيد رأس السنة الصينية 4 shuts production for roughly two to four weeks, and orders queue up on both sides of the holiday. Peak pre-season months — when camping and fireplace brands all restock at once — stretch queues further.
Building Your Reorder Point
The reorder point calculation is straightforward:
- Calculate lead time demand: average daily demand × total lead time in days.
- Add your safety stock from the formula in the previous section.
- Reorder the moment on-hand plus on-order inventory drops to that level.
For example, if you sell 200 pouches per day and total lead time is 55 days, lead time demand is 11,000 pouches. Add a computed safety stock of, say, 3,200 pouches, and your reorder point is 14,200. When inventory touches that line, you order — no debate, no delay.
One practical tip I give buyers: ask your supplier for a production calendar before peak season. We share ours so purchasing managers can pull reorder dates forward around known bottlenecks rather than discovering them after the PO is placed.
What Ocean Freight Delays Should I Plan for When Importing from China?
Shipping out of Ningbo port every month teaches you humility about transit schedules. I've seen identical bookings to the same US port arrive three weeks apart.
Plan for 25–40 days of ocean transit to the US or Europe, plus a buffer of 7–14 days for port congestion, blank sailings, customs inspection, and inland drayage. Track your actual door-to-door history and use its standard deviation in your safety stock formula.
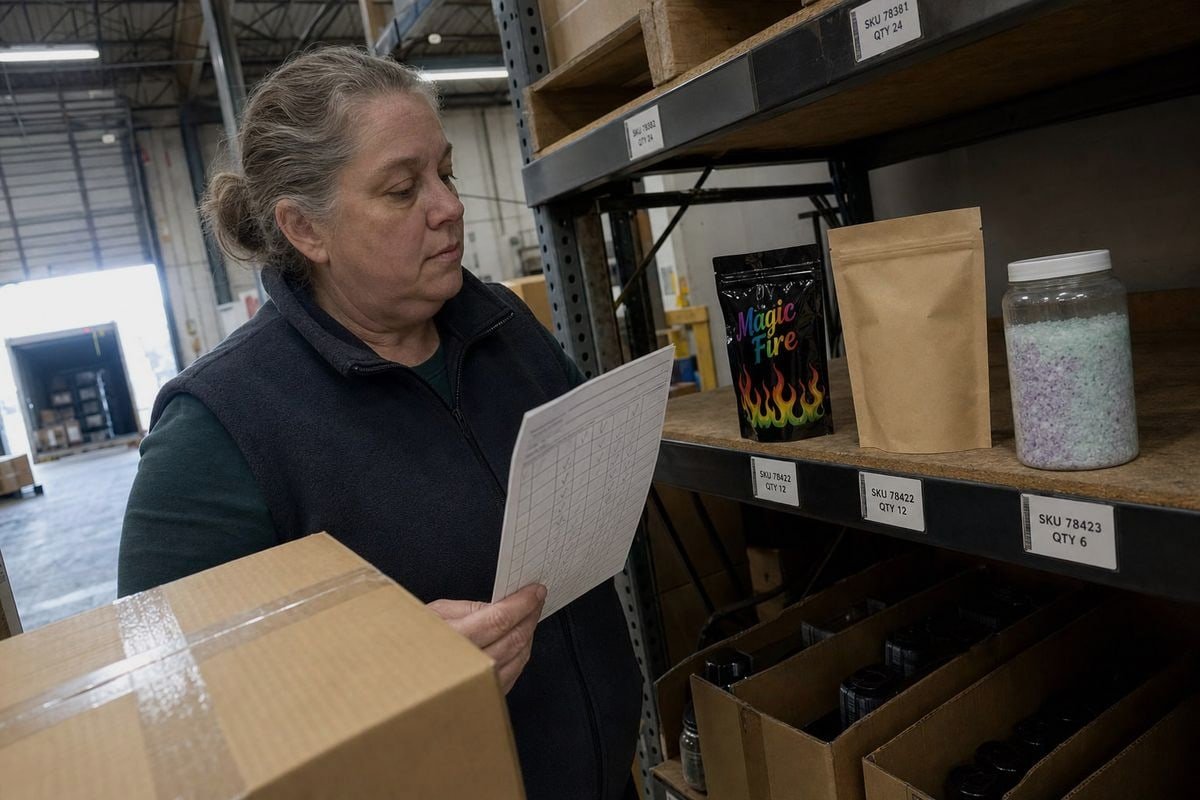
Ocean freight is usually the biggest source of transit time uncertainty in this supply chain — often bigger than production variability. The published sailing schedule is a starting point, not a promise. Here is where the hidden days come from.
The Hidden Delay Components
| مصدر التأخير | التأثير النموذجي | How to Plan for It |
|---|---|---|
| Blank sailings | 7-14 يومًا | Book early; confirm vessel space in writing |
| ازدحام الميناء | 3-14 يومًا | Watch peak-season lane data; buffer Q3–Q4 |
| Customs inspection | 2-10 أيام | Keep test reports and documentation flawless |
| Inland drayage | 2-7 أيام | Pre-book chassis and trucking at destination |
| Rollovers | 7 days per roll | Use reliable forwarders; avoid cheapest quotes |
A quick note on classification, because buyers often raise it. Our Magic Fire color-flame products are made from eco-friendly materials with no harmful chemicals — they are flame-coloring additives, not fireworks. That distinction matters for hazmat logistics: goods with clean تقارير اختبار SGS و Intertek 5 and correct documentation clear customs faster and avoid the extended inspections that regulated hazardous cargo 6 can face. This is one reason we treat full international compliance — ISO 9001 7, BSCI, CE, and third-party test reports — as a hard requirement, not a nice-to-have. Missing or inconsistent paperwork is a self-inflicted delay.
Turning Freight History into a Number
Do not guess your σLT. Pull your last 6–12 shipments and record actual door-to-door days for each. Calculate the average and the standard deviation. If your average is 32 days but your standard deviation is 8 days, that 8 belongs in your formula — it will likely surprise you how much buffer it justifies.
Modern importers go further with dynamic reorder points. Some of our larger distribution clients ingest vessel-tracking data mid-transit and adjust their next order date when a ship reroutes or sits at anchor. You do not need that sophistication on day one. But recalculating your lead time inputs quarterly is a minimum, because lane performance shifts with the seasons.
How Can I Balance MOQ Requirements with Safety Stock to Avoid Overstocking?
Trial-order conversations are where I spend much of my week. A US camping brand recently worried our MOQ would force them to hold a year of inventory — so we restructured the order instead.
Compare your MOQ against total demand over one replenishment cycle plus safety stock. If MOQ exceeds that sum by more than 30–50%, negotiate a lower trial MOQ, split the order across SKU variants, or lengthen your reorder interval so each order absorbs the minimum efficiently.

MOQ and safety stock answer two different questions. Safety stock asks: how much buffer do I need? MOQ asks: how much must I buy per order? Problems appear when the second number dwarfs the first. Excess pouches sitting in a warehouse tie up cash, inflate inventory carrying costs, and — for any moisture-sensitive crystalline powder — risk quality degradation if storage conditions slip. Overstock is not "free safety stock." It is capital and shelf life burning quietly.
A Simple Decision Framework
Work through these steps before signing a PO:
- Compute demand over one full replenishment cycle (daily demand × total lead time).
- Add your calculated safety stock.
- Compare the sum against the MOQ.
- If MOQ is smaller or similar — order normally.
- If MOQ is much larger — negotiate, consolidate, or restructure.
Restructuring Options That Actually Work
Flexible MOQs exist for a reason. At our factory, we regularly split a single minimum across packaging formats — foil sachets, kraft stand-up pouches, and jars — so a buyer hits the MOQ without overstocking any single SKU. That works because we run true one-stop OEM/ODM: same powder, different shelf-ready formats, one production run.
A second option is stretching the reorder interval. If MOQ covers 90 days of demand but your cycle is 60 days, order every 90 days and let the extra 30 days of stock serve as part of your buffer — then reduce your calculated safety stock accordingly, so you are not double-counting.
Also mind your warehouse limits. Storage permits, humidity-controlled space, and insurance ceilings can cap how much product you may legally or practically hold. Your safety stock should never exceed what your facility is approved and equipped to store, regardless of what the formula says. When the formula and the warehouse disagree, shorten the reorder cycle instead of overriding the constraint.
خاتمة
Running out of Magic Fire powder mid-season costs far more than holding a smart buffer. Size safety stock on total lead time, real variability, and sensible service level targets — then recalculate quarterly with a supplier who ships predictably.
ملاحظات ختامية
1. Explains the inventory buffer concept underlying



 English
  Spanish
  German
  French
  Arabic
  Portuguese
انضم إلى المحادثة