






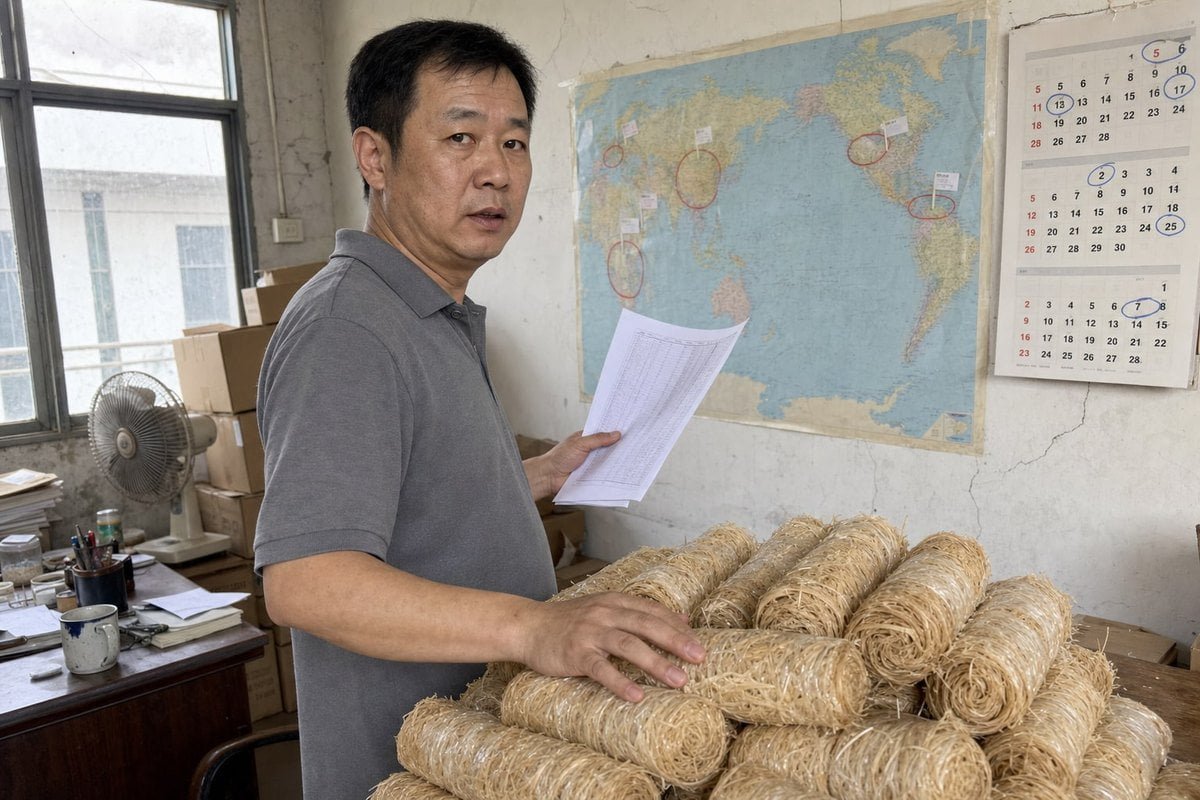
La previsión de la demanda regional en temporada alta de iniciadores de fuego para leña es donde veo que la mayoría de los compradores tropiezan. previsión de la demanda 1 Hacen pedidos tarde, se pierden la ola de frío y ven estantes vacíos mientras los competidores venden.
Para pronosticar la demanda regional de temporada alta de iniciadores de fuego de leña, recopile 2–3 años de historial de ventas a nivel regional, límpielo de desabastecimientos y promociones, construya índices estacionales por región, agregue datos meteorológicos como grados día de calefacción, luego valide con pruebas retrospectivas antes de realizar pedidos de producción antes de cada pico regional.
Esa es la respuesta corta. El resto de este artículo recorre el flujo de trabajo completo, paso a paso, utilizando lo que hemos aprendido enviando productos para iniciar fuego a más de 30 países.
¿Qué datos históricos de ventas debería recopilar para crear una previsión de demanda precisa de iniciadores de fuego de leña?
Hace unos inviernos, un distribuidor alemán nos envió su "historial de ventas" para reordenar nuestros rollos de madera encerados. Era un total nacional anual. Tuvimos que empezar de nuevo juntos.
Necesitas al menos 2–3 años completos de datos de ventas mensuales o semanales, desglosados por región y canal, corregidos por roturas de stock, devoluciones y promociones puntuales. Agrega datos climáticos regionales y calendarios promocionales para que tu historial refleje la demanda real, no solo las ventas registradas.

El mayor error que veo es tratar las ventas registradas como demanda real. No son lo mismo. Si su almacén se quedó sin existencias en diciembre, su número de ventas de diciembre subestima lo que los clientes realmente querían. Introduzca ese número sucio en cualquier herramienta de modelado predictivo y le dirá cortésmente que diciembre es un mes débil. Luego, volverá a pedir menos el año que viene. El error se acumula.
Así que antes de cualquier análisis de series temporales 2, limpie el historial. Aquí tiene cómo se ve un conjunto de datos utilizable:
El conjunto de datos mínimo viable
| Elemento de datos | Granularidad | Por qué importa |
|---|---|---|
| Ventas unitarias por SKU | Semanal o mensual | La señal base para patrones estacionales |
| Ventas por región | Estado, zona climática o metropolitano/rural | Los picos regionales difieren drásticamente |
| Fechas de agotamiento de existencias | Por SKU y ubicación | Corrige la demanda máxima subestimada |
| Promociones y descuentos | Por campaña | Separa la estacionalidad real de los aumentos de precios |
| Devoluciones y cancelaciones | Mensual | Elimina la demanda fantasma |
| Datos climáticos regionales | Promedios mensuales | Explica por qué algunos inviernos tienen picos más fuertes |
Por qué dos o tres años es el mínimo
Un año de datos le muestra un solo ciclo estacional. No puede saber si ese ciclo fue normal o una casualidad. Un invierno suave, una prohibición de quemas por incendios forestales o un retraso en el envío pueden distorsionar toda una temporada. Con dos o tres ciclos, los patrones recurrentes se separan del ruido. Cuando nuestros compradores tienen cinco años, sus pronósticos se vuelven notablemente más precisos, porque la descomposición de tendencias estacionales 3 puede dividir los datos en componentes de tendencia, estacionalidad e irregulares con confianza real.
Adapte la granularidad a sus decisiones. Si repone mensualmente, los datos mensuales están bien. Si su ventana de pico dura solo seis semanas, los datos semanales le mostrarán cuándo comienza realmente la rampa.
¿Qué factores regionales y estacionales afectan más a la demanda de encendedores en temporada alta en mi mercado?
En nuestra experiencia exportando a Canadá y Australia, los mismos iniciadores de fuego alcanzan su punto máximo en meses opuestos. Ese contraste nos enseñó a nunca confiar en un promedio nacional.
Los mayores impulsores son el clima regional (grados día de calefacción y olas de frío), la duración de las temporadas locales de campamento y barbacoa, las tasas de propiedad de estufas de leña y fogatas, la probabilidad de prohibiciones de quema y la combinación de canales. La mayoría de los mercados muestran un patrón bimodal: un pico de calefacción invernal y un pico de recreación al aire libre en verano.

Los iniciadores de fuego son inusuales porque la demanda a menudo tiene dos picos, no uno. Las regiones del norte frío compran mucho de octubre a febrero para chimeneas y estufas de leña. Las regiones recreativas y turísticas compran desde finales de primavera hasta verano para fogatas, braseros y barbacoas. Si combina ambos en un pronóstico nacional, los dos picos se cancelan parcialmente y usted se queda sin preparación en ambas temporadas. Esta es la razón principal por la que les digo a los compradores: pronostique región por región, no como un promedio nacional.
Los factores que vale la pena modelar
| Factor | Lo que predice | Cómo medirlo |
|---|---|---|
| Días de calefacción 4 (Disco Duro) | Demanda de calefacción invernal | HDD históricos de servicios meteorológicos por región |
| Duración de la temporada de campamento | Demanda recreativa de verano | Datos de visitas a parques, métricas de participación regional |
| Propiedad de aparatos de leña | Demanda recurrente base | Ventas entre categorías de estufas y braseros |
| Probabilidad de prohibición de quemas | Demanda máxima suprimida | Índices históricos de sequía y calidad del aire |
| Mezcla de canales | Momento de la demanda minorista | Venta inicial frente a venta final por canal |
Lectura de los patrones de compra del consumidor por región
Los grados día de calefacción merecen especial atención. En mercados más fríos, hemos visto que los pedidos de iniciadores de fuego siguen de cerca los HDD: cuando una región acumula más días fríos que su promedio histórico, la venta final se acelera en cuestión de semanas. Los mercados cálidos, por el contrario, responden más a los fines de semana secos y a las barbacoas festivas que a la temperatura en general.
Observe también los indicadores adelantados. El interés de búsqueda regional en términos como "entrega de leña" tiende a preceder a las compras de dos a cuatro semanas. Es una señal de alerta temprana y económica de que un pico está llegando antes o con más fuerza de lo que predijo su índice estacional. Finalmente, modele el riesgo de prohibición de quemas en regiones propensas a la sequía. Una restricción en la quema de leña abierta puede aplanar un pico con el que contaba, por lo que un pronóstico ponderado por probabilidad es más seguro que una repetición ingenua del año pasado.
¿Cómo puedo trabajar con mi fabricante para alinear los plazos de entrega de producción con mi demanda pronosticada?
Cada agosto, nuestras líneas de producción de Ningbo alcanzan su período más activo, porque los compradores de EE. UU. y Europa compiten por la misma ventana del cuarto trimestre. Los compradores que pronostican con anticipación siempre obtienen las mejores franjas horarias.
Comparta su pronóstico regional con su fabricante entre 90 y 120 días antes de su primer mes pico. Trabaje hacia atrás desde el pico: tiempo de producción más flete marítimo más aduanas más distribución terrestre. Reserve capacidad con anticipación, divida los pedidos grandes en envíos escalonados y acuerde una cadencia de actualización de pronóstico continua.

La matemática del tiempo de entrega no es complicada, pero es implacable. Suponga que su pico de calefacción en el Medio Oeste comienza a fines de octubre. El transporte marítimo desde China a un centro de distribución del Medio Oeste de EE. UU. dura aproximadamente de cinco a siete semanas de puerta a puerta en una temporada normal, y más durante la congestión previa a las fiestas. Agregue tiempo de producción, control de calidad y distribución interna, y su orden de compra 5 debe confirmarse en junio o principios de julio. Pida en septiembre y estará abasteciendo los estantes en diciembre, después de que ya haya ocurrido el aumento.
Un proceso simple de planificación inversa
- Fije la fecha de inicio de su primer pico regional, basándose en sus índices estacionales.
- Reste el tiempo de distribución interna y de abastecimiento minorista (generalmente 1-2 semanas).
- Reste el tiempo de despacho de aduanas y manipulación en el puerto (1-2 semanas, más en temporada alta).
- Reste el tránsito marítimo (4-6 semanas a EE. UU. o Europa).
- Reste el tiempo de entrega de producción y control de calidad (confirme esto con su fábrica; se alarga en temporada alta de reservas).
- El resultado es su última fecha segura de orden de compra. Muévala antes para tener un margen.
Cómo es una buena colaboración con el fabricante
Desde nuestro lado de la mesa, lo más valioso que un comprador puede compartir no es un pedido más grande. Es un pronóstico continuo. Cuando un distribuidor nos envía pronósticos regionales trimestralmente, podemos reservar capacidad de línea, precomprar lana de madera y parafina, y preparar materiales de embalaje para sus cajas de marca blanca 6 antes de la prisa. Esa es una optimización genuina de la cadena de suministro, y protege a ambas partes. Debido a que operamos nuestras propias líneas de producción con control de calidad lote a lote, un pronóstico temprano también significa que los primeros contenedores coinciden exactamente con la muestra aprobada, sin sustituciones apresuradas. Los envíos escalonados también ayudan: envíe el 60% antes del pico, luego active el saldo basándose en la venta inicial en lugar de las conjeturas.
¿Qué estrategias de inventario y MOQ me ayudan a evitar roturas de stock o exceso de stock durante la temporada alta de iniciadores de fuego?
La disyuntiva que más a menudo considero con los compradores es simple: muy poco stock pierde la temporada, demasiado stock inmoviliza efectivo hasta el próximo año. Los iniciadores de fuego hacen que esta tensión sea aguda porque la ventana de venta es corta.
Establezca niveles de stock de seguridad por región basándose en el error de pronóstico, no en la intuición. Utilice pedidos escalonados: un pedido base dimensionado según el pronóstico conservador, más un complemento flexible pre-reservado. Negocie cantidades mínimas de pedido (MOQ) por SKU que faciliten las pruebas y realice un seguimiento de la tasa de venta minorista semanal frente a su índice estacional para activar los re-pedidos anticipadamente.
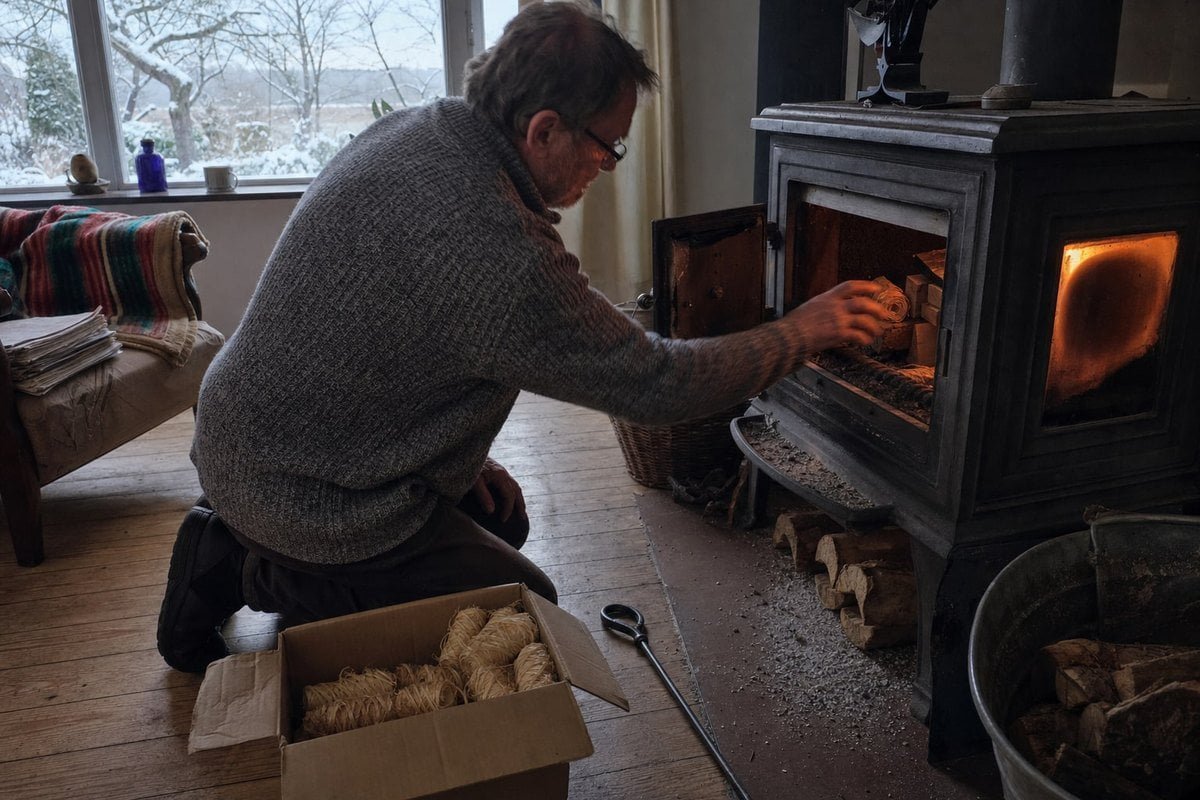
Los iniciadores de fuego de madera son estables en el estante, lo que ayuda. El exceso de existencias no se estropeará como la comida. Pero aún así aplasta su relación de rotación de inventario 7, inmoviliza espacio de almacén durante la temporada baja y retrasa su próximo ciclo de compras. Las roturas de stock son peores de otra manera: en una ventana pico de seis semanas, las ventas perdidas se pierden para siempre, y los compradores minoristas recuerdan qué proveedor dejó el estante vacío.
Ajuste la estrategia a la confianza de su pronóstico
| Doble pila de palés solo si la clasificación de la caja lo permite con margen | Estrategia recomendada | Enfoque MOQ |
|---|---|---|
| Pico regional estable y repetitivo | Pedido base completo, 2-3 semanas stock de seguridad 8 | MOQ estándar, mejor precio unitario |
| Región volátil o impulsada por el clima | Pedido base más pequeño más recarga pre-reservada | Negociar un MOQ de envío dividido |
| Región nueva o SKU nuevo | Pedido de prueba, observe la venta final semanalmente | Solicitar un MOQ de prueba flexible |
| Mercado bimodal (invierno + verano) | Dos construcciones estacionales separadas | Dos pedidos más pequeños superan un pedido combinado |
Stock de seguridad y desencadenantes de reorden
Tamaño del stock de seguridad según su error histórico de pronóstico por región, no un porcentaje fijo en general. Una región donde sus backtests se perdieron el volumen pico en un 25% necesita un mayor margen que una donde se perdieron en un 8%. Luego, monitoree la venta final semanalmente durante el aumento. Si el movimiento real supera su índice estacional durante dos semanas consecutivas, active el envío de recarga inmediatamente, porque su reloj de tiempo de entrega ya está en marcha.
Sobre los MOQ, hable honestamente con su fábrica. Regularmente estructuramos MOQ de prueba más bajos para SKUs nuevos o regiones nuevas, y luego aumentamos a los compradores a volúmenes estándar una vez que el patrón regional se demuestra. Un proveedor que insiste en un único pedido ciego gigante para un producto de temporada está transfiriendo todo el riesgo de pronóstico a usted. Un buen socio de fabricación lo comparte.
Conclusión
Adivinar la demanda máxima cuesta dinero real en ambos lados del error. La solución es un flujo de trabajo repetible, no un modelo más sofisticado.
Comience con dos o tres años de historial de ventas limpio a nivel regional. Corríjalo para desabastecimientos y promociones para que refleje la demanda real. Cree índices estacionales para cada región, incorpore datos climáticos regionales como los grados día de calefacción y espere picos bimodales en muchos mercados. Valide todo con retro-pruebas continuas, verificando el momento y el tamaño del pico región por región, antes de comprometer una sola orden de compra.
Luego, traduzca el pronóstico en acción. Trabaje hacia atrás desde cada pico regional para establecer su última fecha de pedido segura. Comparta pronósticos continuos con su fábrica para que la capacidad, las materias primas y el empaque de marca privada se reserven antes de la temporada alta. Utilice pedidos escalonados, existencias de seguridad razonables y monitoreo semanal de ventas para mantenerse ágil dentro de la temporada.
Después de más de 17 años produciendo encendedores de fuego de madera y productos de llama de color para compradores en todo EE. UU., Europa y más allá, el patrón es claro para nosotros: los distribuidores que ganan la temporada alta no son los que tienen los mayores presupuestos. Son los que pronostican región por región, piden con anticipación y tratan a su fabricante como un socio de planificación. Si usted puede aportar los datos regionales, una fábrica certificada y compatible puede encargarse del resto.
Notas al pie
Entrada autorizada de Wikipedia sobre principios de pronóstico de la demanda. ↩︎
Explica el método estadístico de análisis de una secuencia de puntos de datos recopilados a lo largo del tiempo. ↩︎
Describe el método matemático de separación de datos de series temporales en componentes estacionales y de tendencia distintos. ↩︎
Guía gubernamental autorizada para comprender los grados día como medida de la demanda de energía para calefacción. ↩︎
Entrada autorizada de Wikipedia sobre documentación de órdenes de compra. ↩︎
Define la práctica comercial de fabricar productos para la venta bajo el nombre de marca de otra empresa. ↩︎
Entrada autorizada de Wikipedia sobre métricas de rotación de inventario. ↩︎
Entrada autorizada de Wikipedia sobre gestión de existencias de seguridad. ↩︎


 English
  Spanish
  German
  French
  Arabic
  Portuguese
Únete a la conversación